
BANGLADESH UNIVERSITY OF ENGINEERING AND TECHNOLOGY
DEPARTMENT OF INDUSTRIAL AND PRODUCTION ENGINEERING
IPE 304
A Report On
Semi-Automated Shoe Cleaning Machine
A Report On
Semi-Automated Shoe Cleaning Machine
Course No: IPE 304 | Course Title: Product Design-II Sessional
Date of Submission: 15-12-2024
Submitted To
- Dr Shuva Ghosh
Associate Professor - Dr A.B.M. Mainul Bari
Associate Professor - Nafisa Anzum Sristi
Lecturer - Zahin Ar Rafi
Lecturer
Department of Industrial and Production Engineering, BUET
Submitted By: Group- B14
- Md. Muqtadir Fuad
Student ID: 2008079 - Abdullah Al Mazid
Student ID: 2008080 - Md. Ashiqur Rahman Noor
Student ID: 2008081 - Md Sadiqul Haque
Student ID: 2008082 - Ananya Halder
Student ID: 2008083 - Yashna Noor
Student ID: 2008084
Department of Industrial and Production Engineering, BUET
COPYRIGHT NOTICE
All Rights Reserved
All rights reserved. This document is protected by copyright. No part of this document may be reproduced or transmitted in any form or by any means, electronic or mechanical, including photocopying, recording, or by any information storage and retrieval system, without prior written permission of the authors and the Department of Industrial and Production Engineering, BUET.
FORWARDING LETTER
Dr. Shuva Ghosh, Associate Professor
Dr. A.B.M. Mainul Bari, Associate Professor
Nafisa Anzum Sristi, Lecturer
Zahin Ar Rafi, Lecturer
Department of Industrial and Production Engineering, BUET
Honorable Teachers,
It is our great pleasure to present the report entitled “Semi-Automated Shoe Cleaning Machine” to you. We are very thankful to you for your kind help to accomplish this product design project.
The semi-automated shoe cleaning machine is a unique innovation that combines traditional cleaning methods with modern technology to deliver an efficient and user-friendly experience. By incorporating semi-automated mechanisms, the machine allows users to control the cleaning process, ensuring thorough cleaning and polishing of shoes with minimal effort. In this report, we showcased the functions, working principles, manufacturing processes, and overall costing of the Semi-Automated Shoe Cleaning Machine.
We would like to thank you for your cooperation in completing this project. We solemnly apologize for the involuntary mistakes, if there are any.
Sincerely yours,
Student ID: 2008079
Student ID: 2008080
Student ID: 2008081
Student ID: 2008082
Student ID: 2008083
Student ID: 2008084
Level-3, Term-2 • Department of Industrial and Production Engineering, BUET
PREFACE
Engineering design is a creative and systematic process of developing a product or system to meet specific needs. It is an iterative process involving repeated problem-solving, testing, and refinement cycles. This report presents the design of a semi-automated shoe-cleaning machine. The machine can clean, and polish, making it a versatile tool for personal and commercial use.
The report begins by discussing the need for the machine and the target market. It then describes the design process, including the problem definition, concept generation, and evaluation. The report also discusses the manufacturing process and cost analysis. The goal of this report is to share the design process for the semi-automated shoe-cleaning machine and to encourage students to engage in creative product design.
The need for a semi-automated shoe-cleaning machine is evident in households and commercial spaces such as hotels and offices. Users need a machine that can perform a variety of tasks, such as cleaning, polishing, and sanitizing shoes efficiently. Current methods on the market are either too labor-intensive or lack versatility. The target market for the semi-automated shoe-cleaning machine is individuals and organizations that value convenience and efficiency in shoe care. The machine is user-friendly and can be utilized by people with varying levels of technical expertise.
The design process for the semi-automated shoe-cleaning machine began with a problem definition. We identified the needs of users and the shortcomings of current solutions available on the market. We then generated a variety of concepts for the machine. These concepts were evaluated based on their functionality, manufacturability, and cost. The final design of the machine was chosen for its ease of use, versatility, and cost-effectiveness. The machine is made of durable materials, ensuring longevity and easy maintenance. It is also equipped with safety features to protect the user during operation.
We hope that this report will be informative and helpful to students who are interested in product design. We also hope that this report will inspire students to engage in creative and innovative product development.
ABSTRACT
The “Semi-Automated Shoe Cleaning Machine” report presents a comprehensive study conducted in the context of Bangladesh, focusing on the development and evaluation of an innovative cleaning solution that combines traditional cleaning methods with semi-automated technology. In a country where efficient and hygienic cleaning solutions are becoming increasingly necessary, this product is designed to cater to individuals and small businesses seeking an affordable and user-friendly shoe cleaning solution.
Based on the market survey results, we determined the customer requirements and technical specifications, along with their relationships and correlations. We then conducted qualitative analysis of material, manufacturing processes, and joining process selections. Following this, we performed quantitative analyses by calculating relative emphasis coefficients using the Digital Logic Method and performance indices. Additionally, we conducted equivalent (von Mises) stress, total deformation, fatigue life, and fatigue safety factor analyses using Ansys. Finally, we performed cost, breakeven, and sensitivity analyses for our product.
Hopefully, this report will encourage students to design and analyze their own innovative products.
ACKNOWLEDGEMENT
We want to express our sincere appreciation to our esteemed faculty members, Dr. Shuva Ghosh, Dr. A. B. M. Mainul Bari, Zahin Ar Rafi, and Nafisa Anzum Sristi for their unwavering patience, invaluable guidance, and unwavering support in the creation of this report and throughout the course. We are truly fortunate to have had the opportunity to engage in a real-world project, developing new product ideas, and honing our skill sets under their mentorship. Their insightful suggestions and the time they dedicated to mentoring us throughout the course were instrumental in the successful completion of this project, especially within the stipulated timeframe.
We would also like to express our deep appreciation to people from different corporate offices whose generous support made our field research possible. Their provision of valuable market insights and encouragement was instrumental in propelling our project forward. While preparing this report, we encountered and surmounted significant challenges, and we cherished every moment of the journey.
Lastly, we emphasize that this report is the culmination of collective effort and could not have been accomplished without the equal and vital contributions of each team member. We extend our heartfelt gratitude to our esteemed faculty members and everyone who collaborated with us on this endeavor.
TABLE OF CONTENTS
List of Tables
List of Illustrations
Introduction
1.1Product Design
Product design is the process of creating new products or services, or improving existing ones, through strategic and tactical activities focused on customer needs and market demand. A design must balance its goals and constraints while accounting for aesthetic, functional, economic, and social considerations.
Effective product design combines ergonomics, usability, and manufacturing feasibility. It uses analysis and problem-solving to translate user needs into an engineered solution, balancing the factors that shape how a product looks, works, is produced, and interacts with its environment.
1.2Proposed Product Ideas
The team initially proposed four product concepts for Product Design Sessional-I.
Proposal 01
Multifunctional Canal & River Cleaning Machine
This concept removes waste from rivers, canals, and drainage systems to reduce water pollution, protect aquatic life, prevent blockages and flooding, and support safer water supplies.
Main components
- Waste-carrying conveyor
- Disinfectant sprayer
- Carrier vehicle
Notable features
- Collects solid and semi-solid waste floating on the water.
- Automates the waste-collection conveyor.
- Stores collected waste in an ejectable, transportable basket.
- Uses a remotely controlled carrier vehicle.
- Allows the sprayer, conveyor, and carrier vehicle to operate independently.
Target market
Government organizations such as city corporations, municipalities, and water-management authorities, as well as non-government organizations working to prevent water pollution and maintain ecological balance.
Proposal 02
Multi-Functional Cleaner
A single machine designed to handle several cleaning operations, reducing the need to purchase and store separate devices for different household cleaning tasks.
Main components
- Motors and rotating shafts
- Brush rollers
- Polishing and mopping pad
- Detergent sprayer
- Water tank
- Suction nozzle
- Vacuum chamber with exhaust port
- Power source
Notable features
- Versatility: Performs several cleaning operations with one machine.
- Wet and dry cleaning: Adapts to the cleaning method required by the situation.
- Ergonomics: Supports comfortable operation.
- Accessories: Uses detachable parts for easier handling and task-specific setup.
Target market
Busy households, working professionals, elderly users seeking convenience, apartment residents with limited storage, and pet owners who need frequent floor-cleaning solutions.
Proposal 03
Pedal-Powered Dishwasher
A manually operated dishwasher that cleans dishes without electricity by using two counter-rotating discs around a stationary rack.
Pedal motion is transferred through a rack-and-pinion mechanism to a vertical shaft. The shaft rotates the internal and external discs in opposite directions, creating water jets around dishes held in a rack that exposes most surfaces to the flow.
Main components
- Container
- Internal and external rotating discs
- Rack
- Shaft
- Gear system
- Pedal and sprockets
Notable features
- Uses a simple mechanical system.
- Provides a low-cost design.
- Can use pedal power, with an optional motor.
- Targets a capacity of at least 30 dishes or plates in approximately 10 minutes.
Target market
Households and restaurants, particularly busy restaurants that need to clean dishes quickly and consistently between service cycles.
Proposal 04
Semi-Automated Shoe Cleaning Machine
A faster and more convenient way to clean and polish shoes at building entrances or designated cleaning zones, helping prevent dirt transfer and reducing manual cleaning effort.
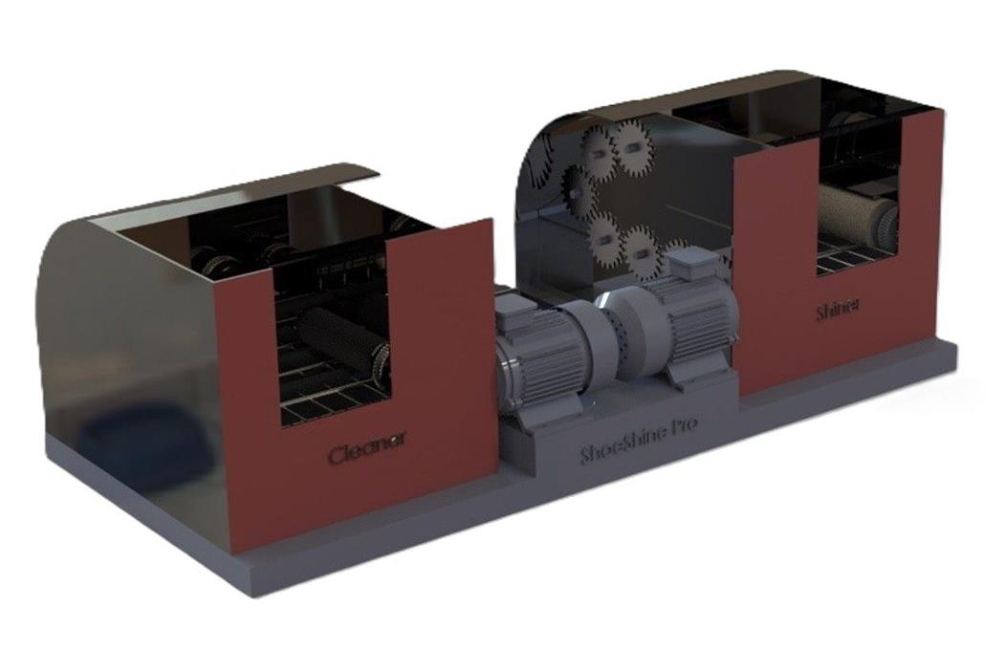
An adjustable drawer-like sole-cleaning chamber uses high-speed roller brushes to remove debris. Multi-axis synthetic brushes clean the shoe upper, while a spring-mounted sponge on a vibrating plate follows the shoe surface during polishing.
Main components
- Shoe-sole cleaning chamber
- Brush-cleaning chamber
- Shoe-shining chamber
Notable features
- Provides adjustable brushes for cleaning and polishing.
- Applies polishing spray automatically.
- Reduces manual shoe-cleaning effort.
- Cleans and shines both the upper and sole.
- Removes dry or wet dirt from the sole.
- Supports a cleaner and more hygienic environment.
Target market
Corporate offices, hotels, transportation hubs, healthcare facilities, retail spaces, luxury residences, government buildings, and event venues where cleanliness, convenience, and a professional appearance matter.
1.3Selected Proposal
Final concept
Semi-Automated Shoe Cleaning Machine
After reviewing the four ideas with the course teachers, the fourth proposal was approved as the team project.
1.3.1Reasons for Selection
The selected concept serves corporate offices, hotels, transportation hubs, and other high-traffic facilities where clean footwear supports a professional appearance and better hygiene. It saves time for staff, visitors, and guests by cleaning and polishing footwear with minimal manual effort. The combination of convenience, cleanliness, and a distinctive product concept gives the machine strong potential to attract customer and market interest.
Understanding Customer Needs Through Survey
2.1Introduction
Clean shoes support a professional appearance, but manual cleaning can be inconvenient during a busy day and difficult to arrange at short notice. Rain, dust, and daily travel can soil footwear quickly, creating demand for a fast and accessible cleaning solution.
The survey explored cleaning habits, pain points, desired product features, workplace placement, maintenance expectations, hygiene, sustainability, noise, and willingness to recommend a semi-automated shoe-cleaning machine.
2.2Survey Locations
Bangladesh University of Engineering and Technology (BUET)
Palashi, Dhaka-1000, BangladeshBright River Bangladesh Ltd.
Al-Razi Complex, 3rd Floor, Purana Paltan, Dhaka-1000, BangladeshRural Development Project of Jamalpur
Level 03, REDC Building, LGED Headquarters, Agargaon, Dhaka-1207, BangladeshBRAC Bank PLC, Anik Tower
220/B, Tejgaon-Gulshan Link Road, Tejgaon, Dhaka-1208, BangladeshUniversity of Dhaka
Nilkhet Road, Dhaka-1000, BangladeshPridesys IT Ltd.
R&D Center, Level 11, Software Technology Park, Vision 2021 Tower, Dhaka-1215, Bangladesh2.3Survey Results
The survey collected responses from 34 participants. Each question below includes the original response table and the corresponding chart from the report.
34
Participants
62%
Interested in automatic cleaning
76%
Prefer a portable machine
79%
Have not seen a similar product
68%
Want quiet operation
94%
Likely to recommend
Current behavior and pain points
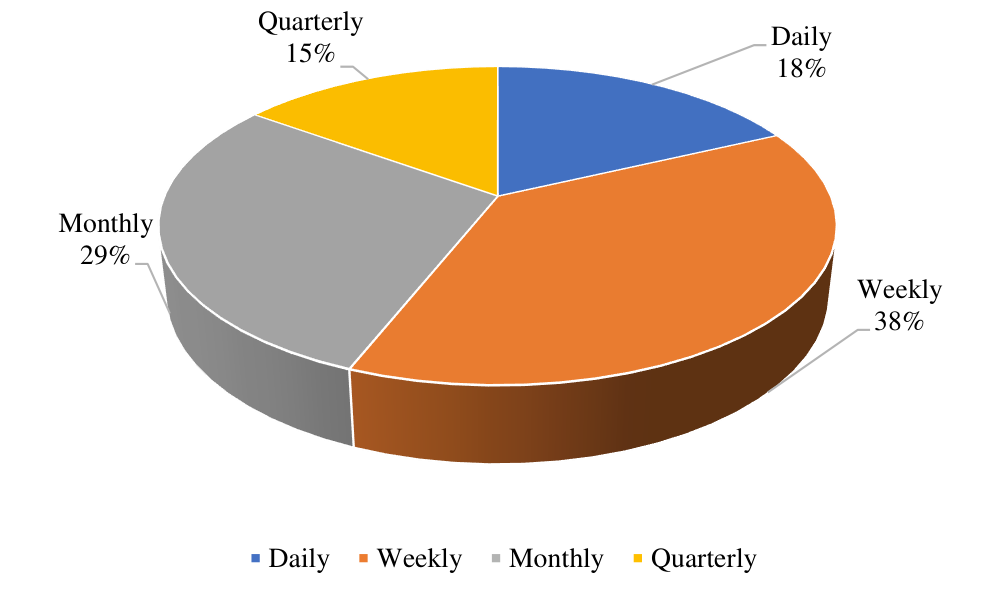
How often do you clean your shoes?
Leading response: Weekly - 38%
| Option | Responses | Percent |
|---|---|---|
| Daily | 6 | 18% |
| Weekly | 13 | 38% |
| Monthly | 10 | 29% |
| Quarterly | 5 | 15% |
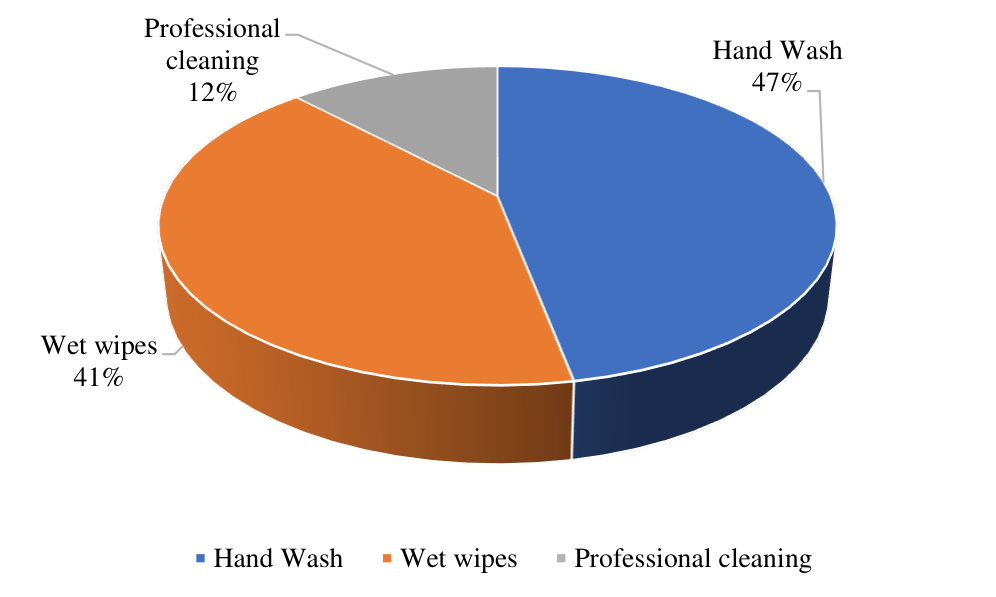
How do you currently clean your shoes?
Leading response: Hand wash - 47%
| Option | Responses | Percent |
|---|---|---|
| Hand wash | 16 | 47% |
| Wet wipes | 14 | 41% |
| Professional cleaning | 4 | 12% |
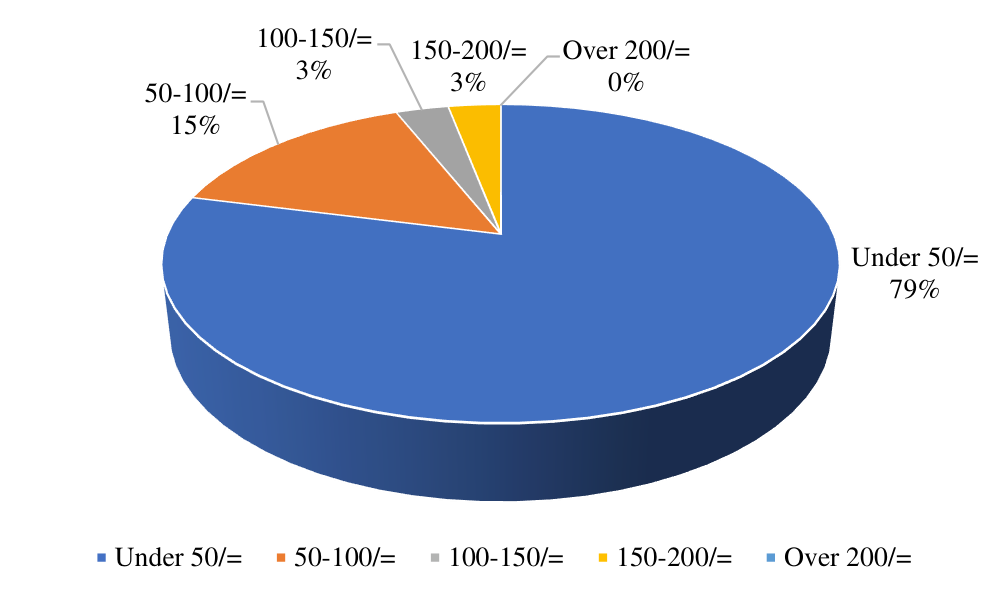
How much do you spend on a single shoe cleaning?
Leading response: Under 50/= - 79%
| Option | Responses | Percent |
|---|---|---|
| Under 50/= | 27 | 79% |
| 50-100/= | 5 | 15% |
| 100-150/= | 1 | 3% |
| 150-200/= | 1 | 3% |
| Over 200/= | 0 | 0% |
What challenges do you face when cleaning your shoes?
Leading response: Time-consuming - 62%
| Option | Responses | Percent |
|---|---|---|
| Time-consuming | 21 | 62% |
| Ineffective | 9 | 26% |
| Unavailability | 4 | 12% |
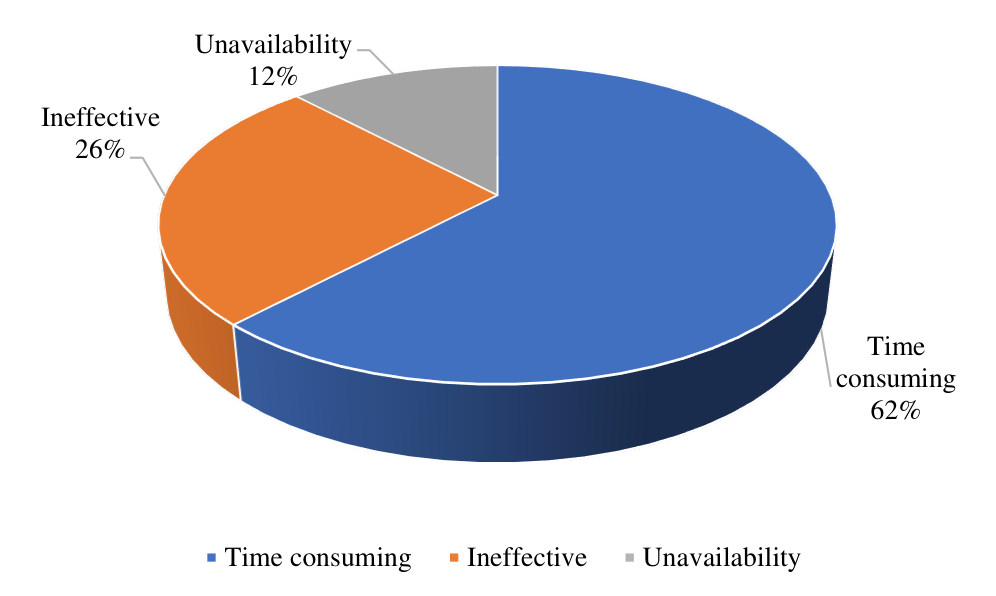
How satisfied are you with your current shoe cleaning method?
Leading response: Neutral - 64%
| Option | Responses | Percent |
|---|---|---|
| Very satisfied | 1 | 3% |
| Satisfied | 5 | 15% |
| Neutral | 22 | 64% |
| Dissatisfied | 4 | 12% |
| Very dissatisfied | 2 | 6% |
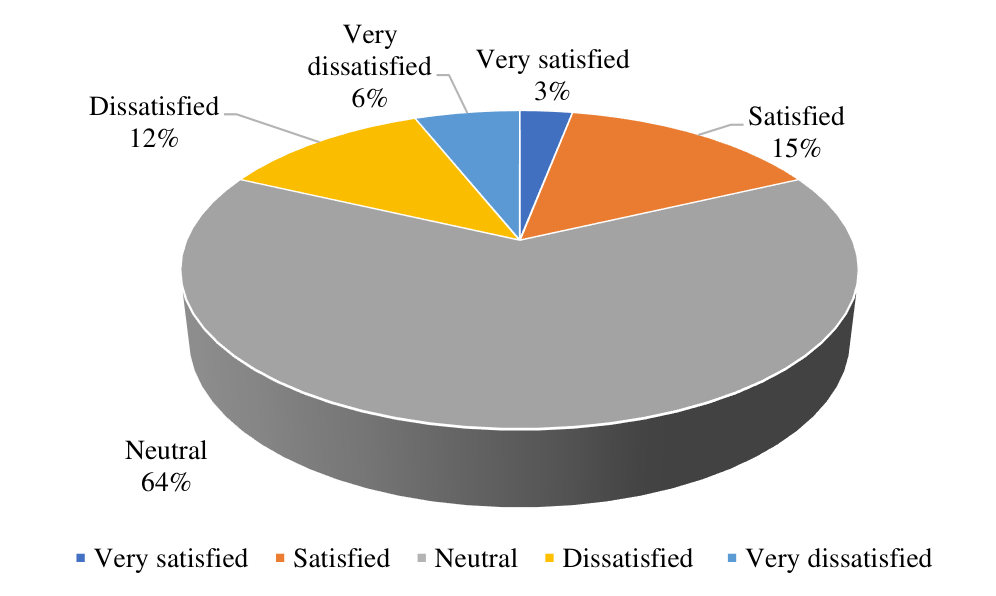
Product interest and purchase preferences
Would you be interested in a machine that cleans your shoes automatically?
Leading response: Yes - 62%
| Option | Responses | Percent |
|---|---|---|
| Yes | 21 | 62% |
| No | 1 | 3% |
| Maybe | 12 | 35% |
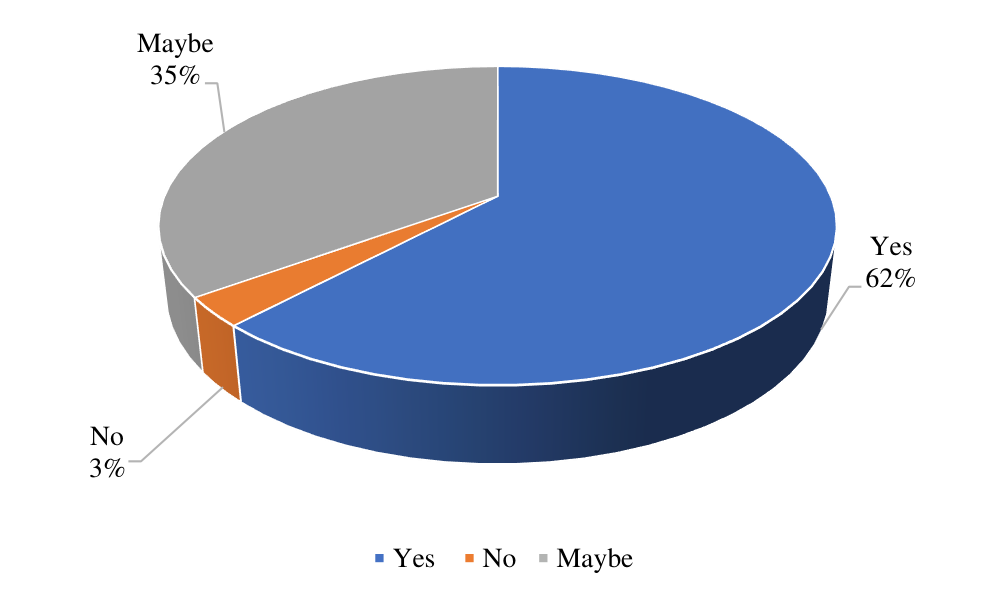
What features would be most important to you in a shoe cleaning machine?
Leading response: Effectiveness - 29%
| Option | Responses | Percent |
|---|---|---|
| Speed of cleaning | 9 | 27% |
| Effectiveness | 10 | 29% |
| Ease of use | 9 | 26% |
| Eco-friendliness | 6 | 18% |
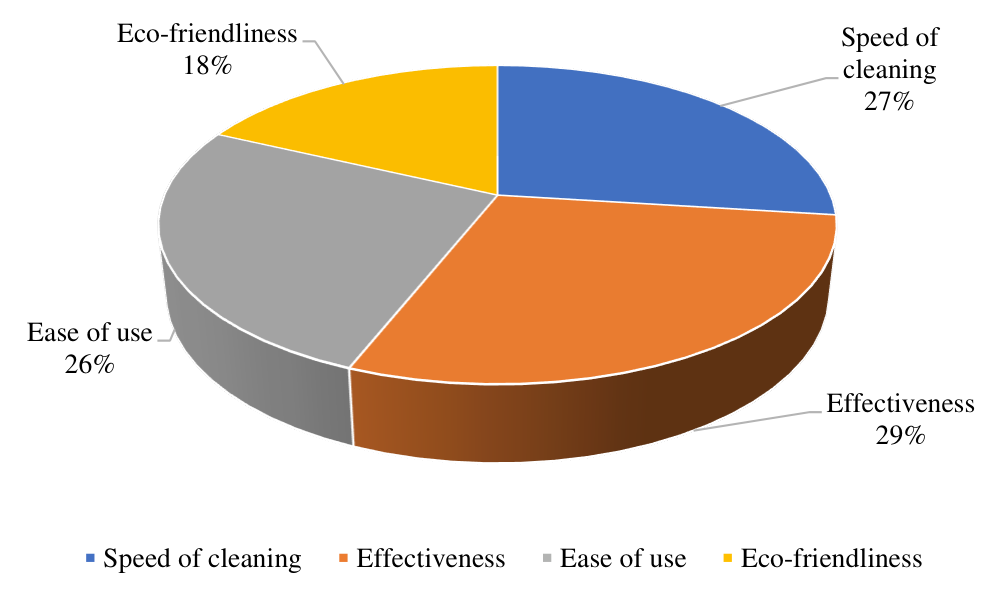
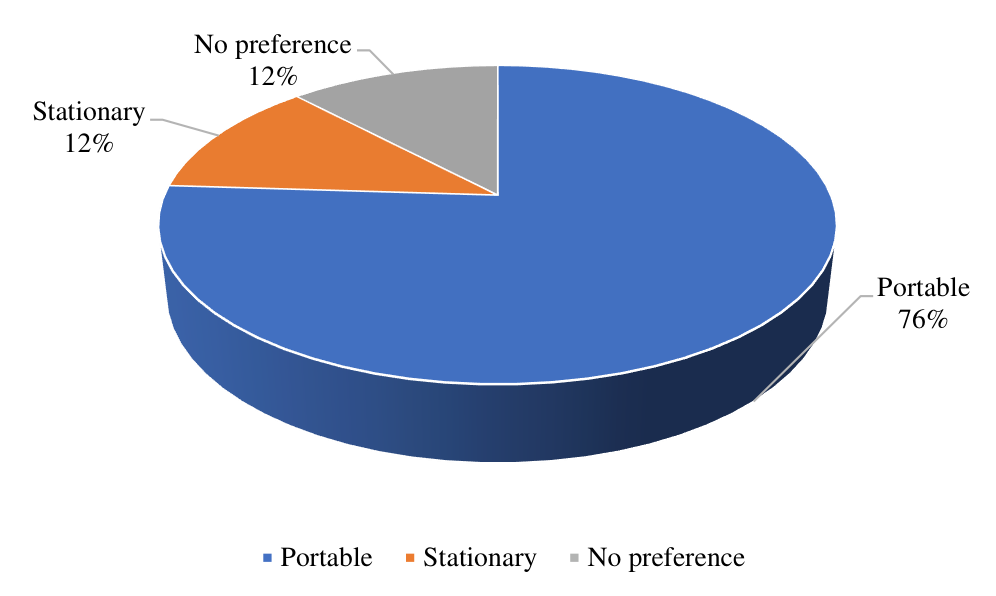
Would you prefer a portable machine or one that stays in one place?
Leading response: Portable - 76%
| Option | Responses | Percent |
|---|---|---|
| Portable | 26 | 76% |
| Stationary | 4 | 12% |
| No preference | 4 | 12% |
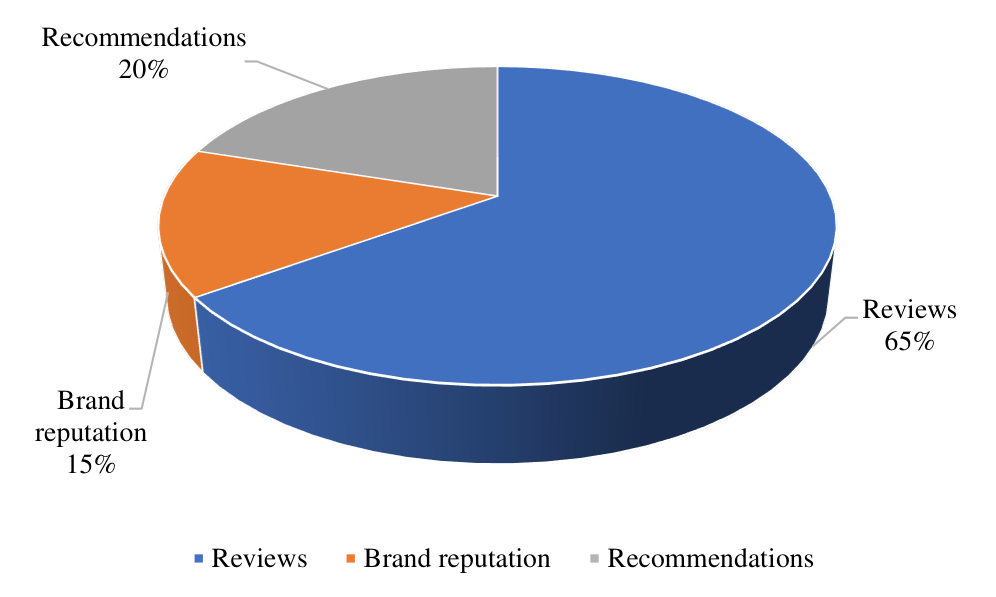
What factors influence your decision to purchase a new cleaning device?
Leading response: Reviews - 65%
| Option | Responses | Percent |
|---|---|---|
| Reviews | 22 | 65% |
| Brand reputation | 5 | 15% |
| Recommendations | 7 | 20% |
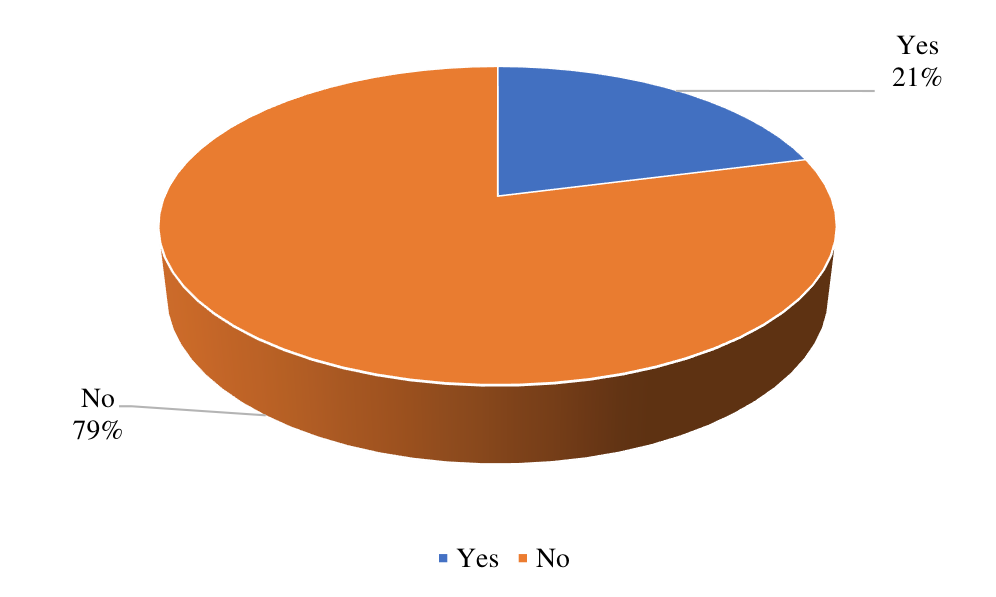
Have you seen similar products on the market?
Leading response: No - 79%
| Option | Responses | Percent |
|---|---|---|
| Yes | 7 | 21% |
| No | 27 | 79% |
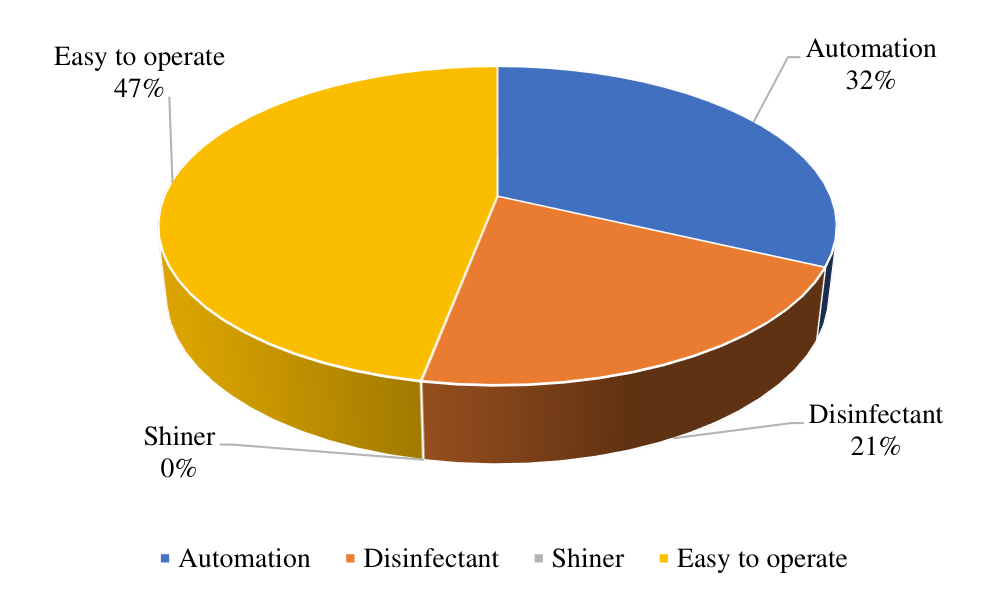
What additional features would make a shoe cleaning machine more appealing to you?
Leading response: Easy to operate - 47%
| Option | Responses | Percent |
|---|---|---|
| Automation | 11 | 32% |
| Disinfectant | 7 | 21% |
| Shiner | 0 | 0% |
| Easy to operate | 16 | 47% |
Workplace deployment and advocacy
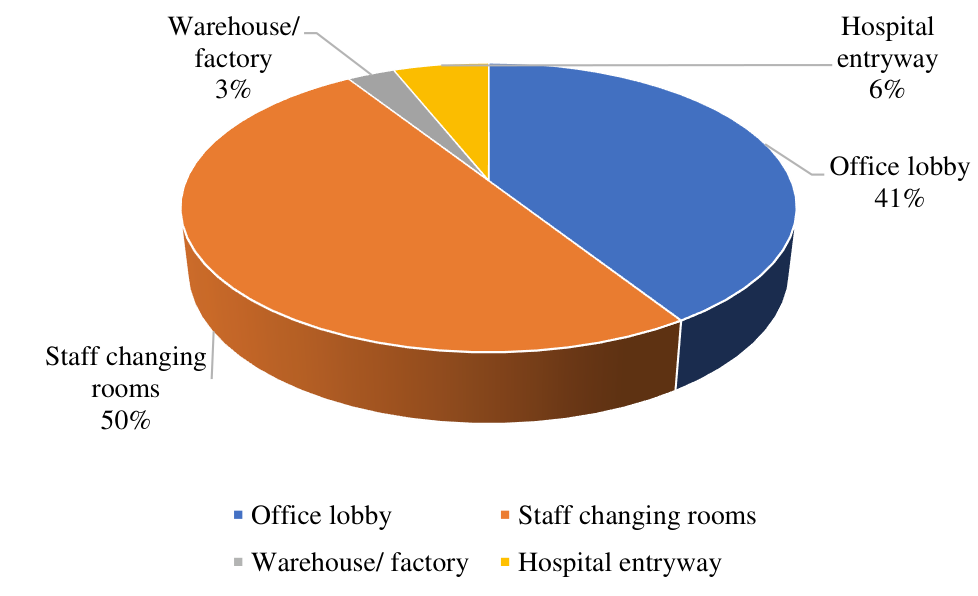
In which workplace environment would the shoe cleaning machine be used most?
Leading response: Staff changing rooms - 50%
| Option | Responses | Percent |
|---|---|---|
| Office lobby | 14 | 41% |
| Staff changing rooms | 17 | 50% |
| Warehouse/factory | 1 | 3% |
| Hospital entryway | 2 | 6% |
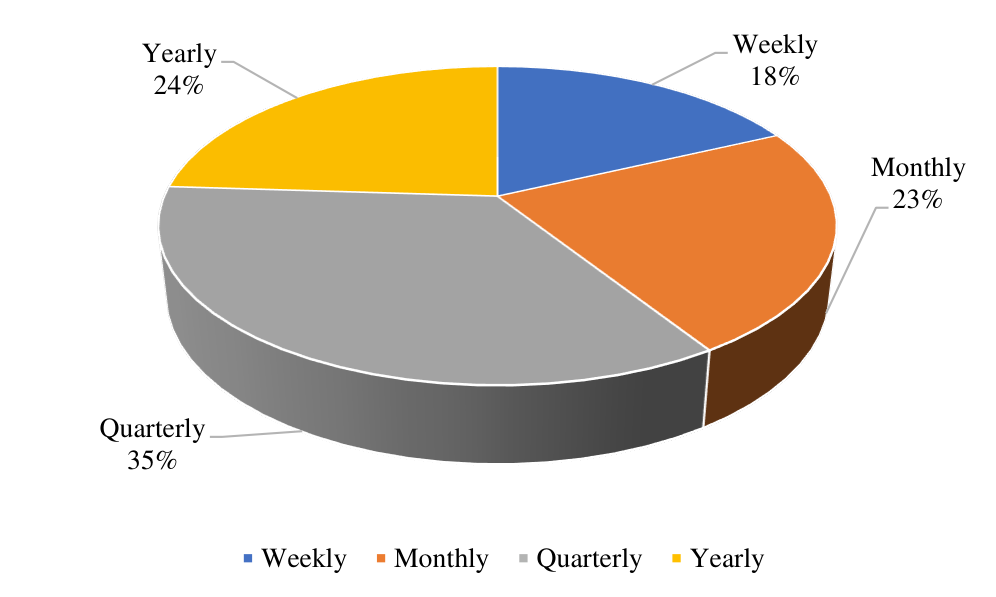
How often would you expect to perform maintenance on such a machine?
Leading response: Quarterly - 35%
| Option | Responses | Percent |
|---|---|---|
| Weekly | 6 | 18% |
| Monthly | 8 | 23% |
| Quarterly | 12 | 35% |
| Yearly | 8 | 24% |
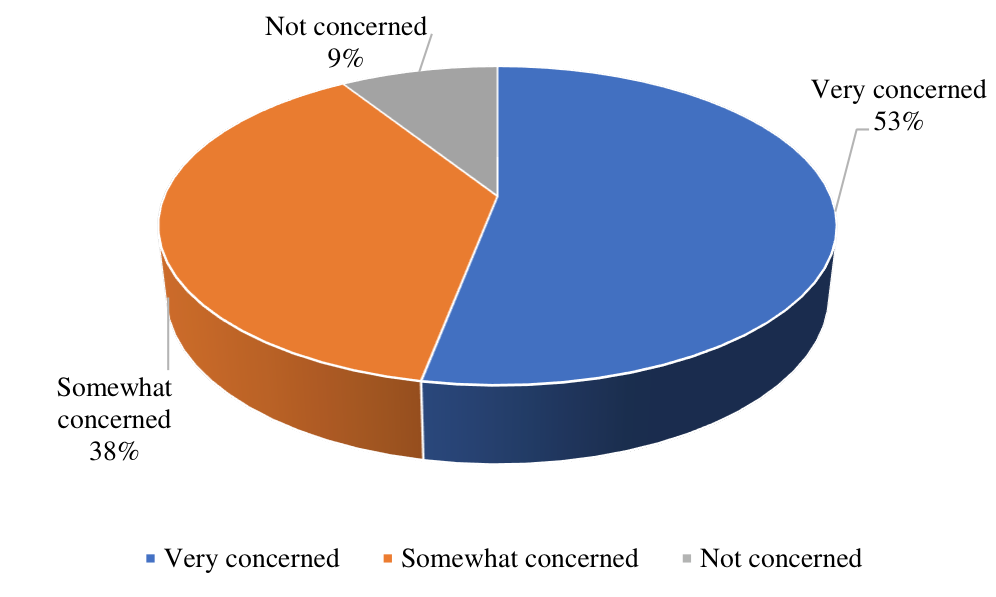
How concerned are you about cross-contamination and hygiene in common areas where the machine might be placed?
Leading response: Very concerned - 53%
| Option | Responses | Percent |
|---|---|---|
| Very concerned | 18 | 53% |
| Somewhat concerned | 13 | 38% |
| Not concerned | 3 | 9% |
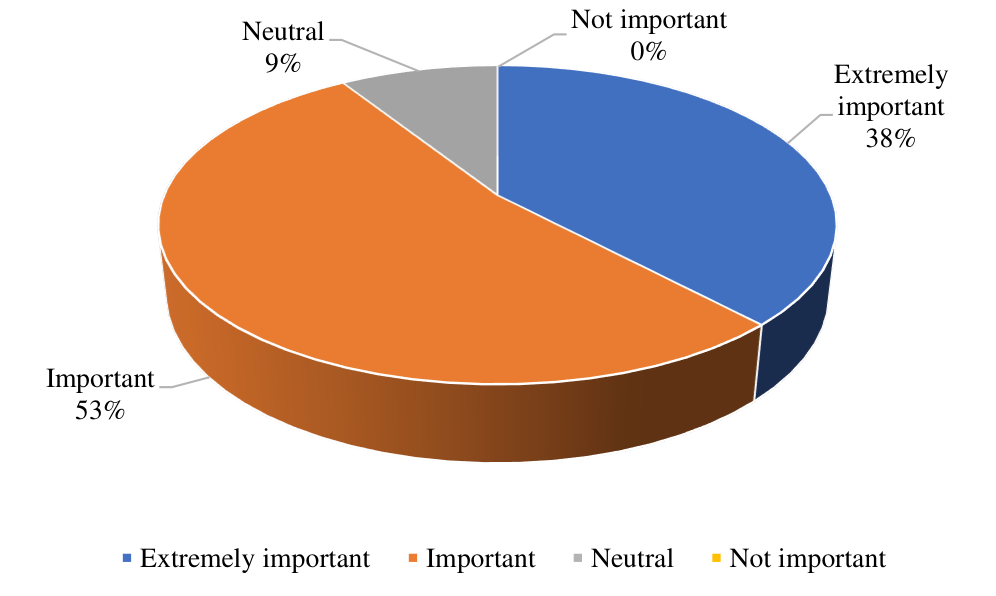
How important are environmentally friendly features such as energy efficiency or low water consumption?
Leading response: Important - 53%
| Option | Responses | Percent |
|---|---|---|
| Extremely important | 13 | 38% |
| Important | 18 | 53% |
| Neutral | 3 | 9% |
| Not important | 0 | 0% |
Would noise levels be a concern in an area with frequent foot traffic?
Leading response: Yes, it should be quiet - 68%
| Option | Responses | Percent |
|---|---|---|
| Yes, it should be quiet | 23 | 68% |
| Noise is acceptable if it is efficient | 9 | 26% |
| No preference | 2 | 6% |
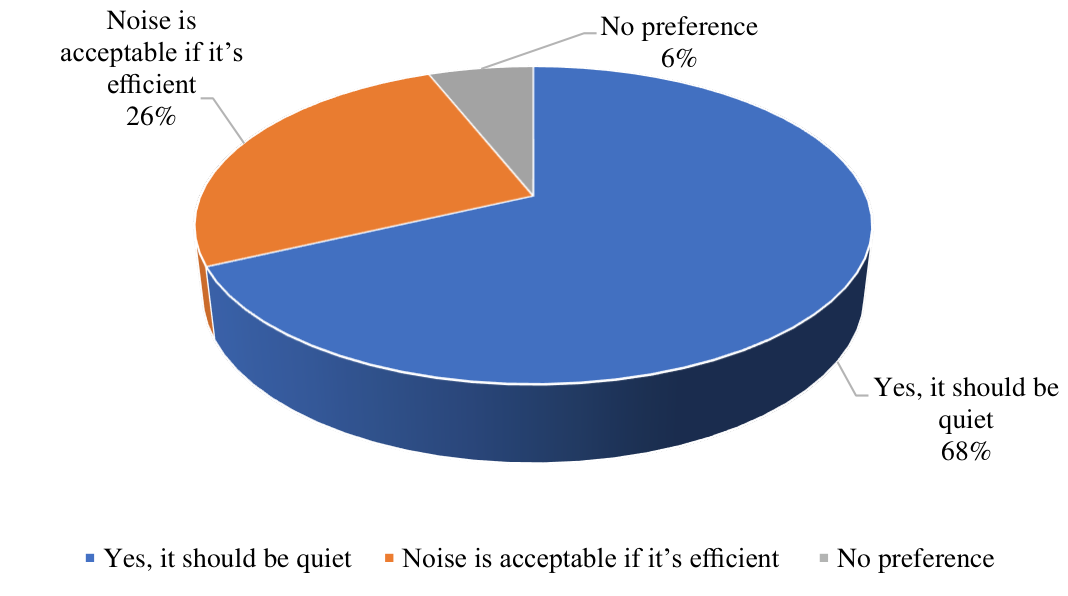
How likely are you to recommend such a machine to other organizations if it meets your expectations?
Leading response: Very likely / Likely - 47%
| Option | Responses | Percent |
|---|---|---|
| Very likely | 16 | 47% |
| Likely | 16 | 47% |
| Neutral | 2 | 6% |
| Unlikely | 0 | 0% |
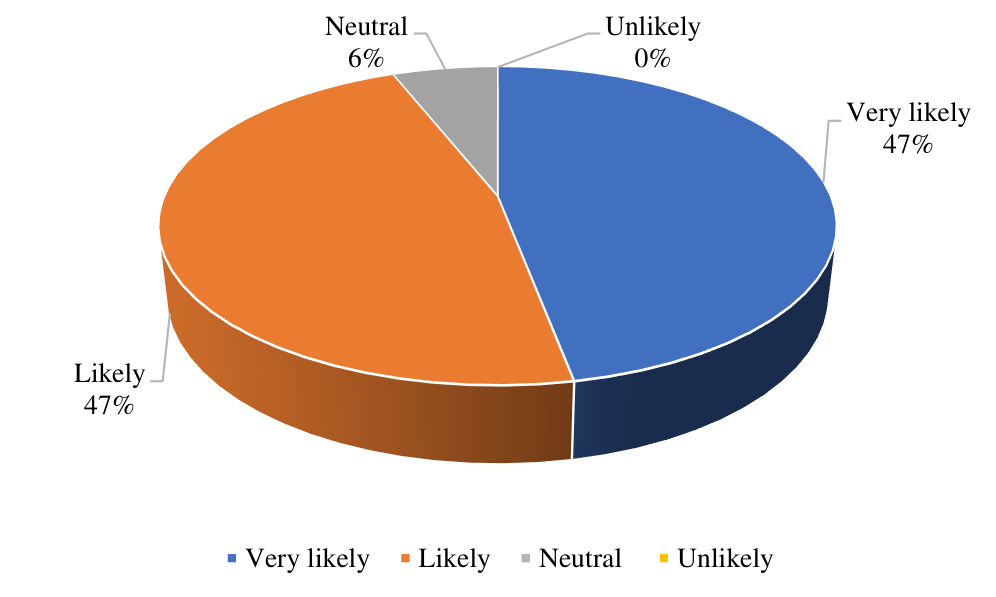
2.4Customer Requirement Evaluation
The survey findings were consolidated into eight customer requirements and evaluated on a ten-point importance scale.
| Customer requirement | Score / 10 | Relative importance |
|---|---|---|
| Easy to operate | 10 |
|
| Portability | 8 |
|
| Automation | 7 |
|
| Eco-friendly | 8 |
|
| Operating speed | 9 |
|
| Effectiveness | 8 |
|
| Low cost | 9 |
|
| Good stability | 8 |
|
2.5Conclusion
The Google Forms survey produced a varied but consistent set of customer priorities. Respondents favored an easy-to-operate, portable, quiet, hygienic, and affordable machine with effective cleaning performance. These findings establish the customer requirements that guide the product design and the quality-function-deployment analysis in the following chapter.
Incorporating the Voice of Customer in Product Design with Quality Function Deployment (QFD)
3.1Introduction
According to the Japanese, Quality Function Deployment (QFD) is "Listen to the voice of the market (customers)," which refers to understanding the design problem to create a high-quality product. One must comprehend the design problem thoroughly. The process of turning user requests and requirements into a technical description of what has to be created is known as Quality Function Deployment, or QFD. The goal of QFD is to create a product that meets the customer's exact needs, rather than focusing on the builder's existing skills or knowledge.
In QFD, multi-skilled teams work together to understand customer needs and define technical requirements for each stage. The key benefits of QFD include a strong focus on customer needs, ensuring that products are developed based on what the customer values rather than depending solely on technical expertise. QFD promotes teamwork by bringing together multi-skilled teams, which enhances a deeper understanding of the project requirements. This approach also improves production efficiency and helps reduce development time and costs. The QFD process emphasizes listening to customers, refining specifications, and assessing how well both the company and competitors meet customer expectations.
Since we have already collected customer needs by conducting the customer survey, the next step in the QFD technique is to evaluate the importance of each of the customers' requirements (out of a 10 scale). This is accomplished by generating a weighting factor.
3.2Customer Requirement and Engineering Requirement
In order to meet the customer requirements, the necessary engineering requirements and their relationship is depicted in the following table:
| Customer Requirement | Engineering Requirement | Relationship | Explanation |
|---|---|---|---|
| Easy to Operate | Chamber Assembly | Strong | Three different chambers allow us to operate the cleaning process more precisely. |
| Vibrating Plate | Moderate | This segment ensures the shining process more significantly. | |
| Portability | Chamber Assembly | Strong | Chamber assembly has made the product more compacted which enhances the product portability. |
| Manufacturing Cost | Moderate | The presence of separate chamber for separate process increases the manufacturing cost slightly. | |
| Automation | Cleaning Design | Strong | An improved cleaning design ensures effective automation of the process. |
| Roller Brush | Strong | Proper functionality of roller brush improves the process automation significantly. | |
| Vibrating Plate | Strong | Improved functionality of vibrating plate improves the process automation significantly. | |
| Operational Cost | Weak | Ensuring self-automated process slightly increases the operational cost. | |
| Manufacturing Cost | Strong | Implementing automated processes tends to raise manufacturing cost. | |
| Eco-Friendly | Brush Material | Strong | Selecting eco-friendly materials for brushes reduces environmental impact. |
| Shiner | Moderate | Choosing eco-friendly materials for shiner promotes sustainability while maintaining effective performance. | |
| Operating Speed | Strength of Body | Weak | A higher operating speed can slightly strain body's strength. |
| Manufacturing Cost | Moderate | Increasing operating speed may raise manufacturing cost. | |
| Operational Cost | Moderate | Increasing operating speed may raise operational cost. | |
| Roller Brush | Moderate | Operating speed of roller brush influences its cleaning efficiency. | |
| Cleaning Design | Moderate | The design of a cleaning system is optimized for operational speed to maximize efficiency. | |
| Shiner | Moderate | The operating speed of a shiner affects its polishing effectiveness. | |
| Effectiveness | Brush Material | Strong | The choice of brush material significantly impacts its effectiveness, influencing durability, compatibility. |
| Manufacturing Cost | Moderate | Enhancing effectiveness typically results in increased manufacturing cost. | |
| Operational Cost | Moderate | Improving effectiveness typically results in increased operational cost. | |
| Roller Brush | Strong | Different types of roller brush enhance effectiveness by catering to specific cleaning needs. | |
| Cleaning Design | Strong | Different cleaning design ensures effectiveness while minimizing time and effort. | |
| Shiner | Strong | A shiner provides effectiveness by utilizing specialized ingredients that create a protective layer, enhance shine and repel dirt. | |
| Low Cost | Brush Material | Moderate | Using lower cost material reduces overall expenses. |
| Manufacturing Cost | Strong | Manufacturing cost can be minimized through efficient process and the use of lower cost material. | |
| Operational Cost | Moderate | Minimizing operational cost leads to lower overall cost. | |
| Cleaning Design | Strong | An effective cleaning design minimizes resource consumption which ensures lowering of overall costs. | |
| Chamber Assembly | Moderate | Chamber assembly can lead to lower cost by reducing number of components needed and minimizing assembly time. | |
| Good Stability | Strength of Body | Strong | The strength of body ensures good stability by providing necessary support and resistance to external forces. |
| Vibrating Plate | Strong | A vibrating plate contributes to good stability by distributing weight evenly. | |
| Roller Brush | Moderate | A roller brush partially provides good stability by maintaining consistent contact with surfaces. | |
| Chamber Assembly | Moderate | Chamber assembly contributes to good stability by securely integrating components. |
3.3Quality Function Deployment's House of Quality
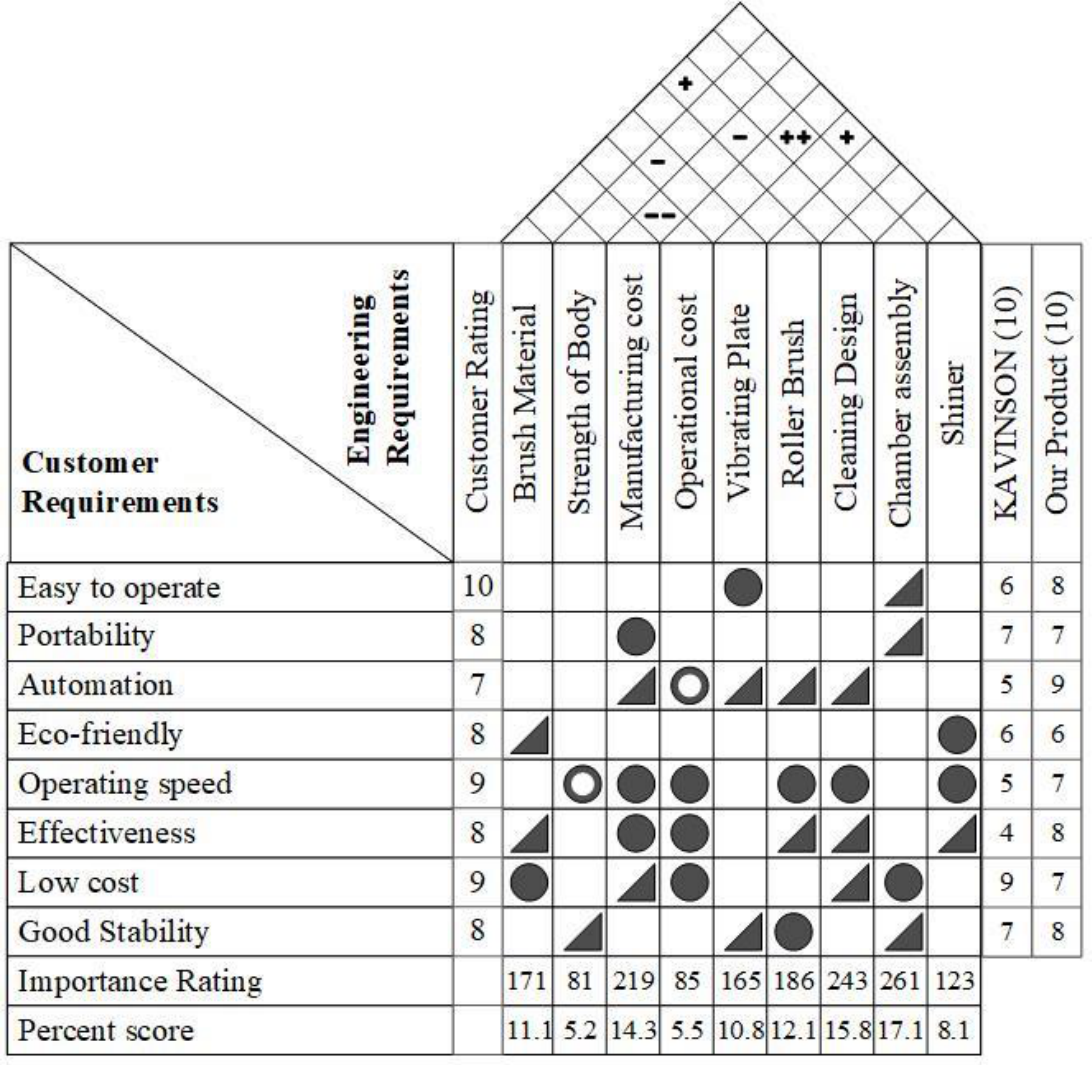
QFD Matrix Relationships
Defines the impact of engineering specifications on customer requirements.
| Relationship Level | Weight Value |
|---|---|
| Strong | 9 |
| Moderate | 3 |
| Weak | 1 |
| No Relationship | 0 |
Roof Technical Correlations
Inter-parameter correlations between engineering requirements.
| Symbol | Correlation Type |
|---|---|
| + + | Strongly Positive |
| + | Positive |
| — | No Relation |
| - | Negative |
| - - | Strongly Negative |
3.4Conclusion
QFD gives a deeper understanding of the problem. It helps to build up consensus within an organization on the measurement systems and performance specifications that represent the demands of the customers. Strategically designed to enhance competitiveness for a company, QFD also identifies and prioritizes actions needed to satisfy the expressed and implied needs of the customer. We were able to develop our QFD process in relatively quick fashion because we were under a very tight schedule—normally, QFD is a very involved, lengthy process. Although this apparently slows down the design phase, time utilized at the front end in gathering information saves time further down the process.
Functional Decomposition
From a single system boundary to three coordinated machine assemblies.
4.1Introduction
Functional decomposition is an analytical approach that breaks a complex system into manageable component functions and processes. It provides a top-down view of increasingly detailed functionality, helping designers understand how each part contributes to the product's overall purpose.
Identify the primary function
Distill the design's core purpose into a simple statement. Represent the system as a black box whose boundary is defined by energy, material, and information inputs and outputs.
Develop sub-functions
Break the primary function into the specific sub-functions needed to support the system's purpose, ensuring that each component contributes to the main goal.
Organize sub-functions
Arrange the sub-functions in a logical sequence so that the process flow remains clear, especially when several elements interact.
Refine sub-functions
Examine each sub-function for further decomposition so every aspect of the function is addressed and the overall system remains coherent.
4.2Black Box Model
A black box model represents a system through its energy, material, and information inputs and outputs without exposing internal details. It gives a high-level account of what the machine does before the design is decomposed into individual mechanisms.
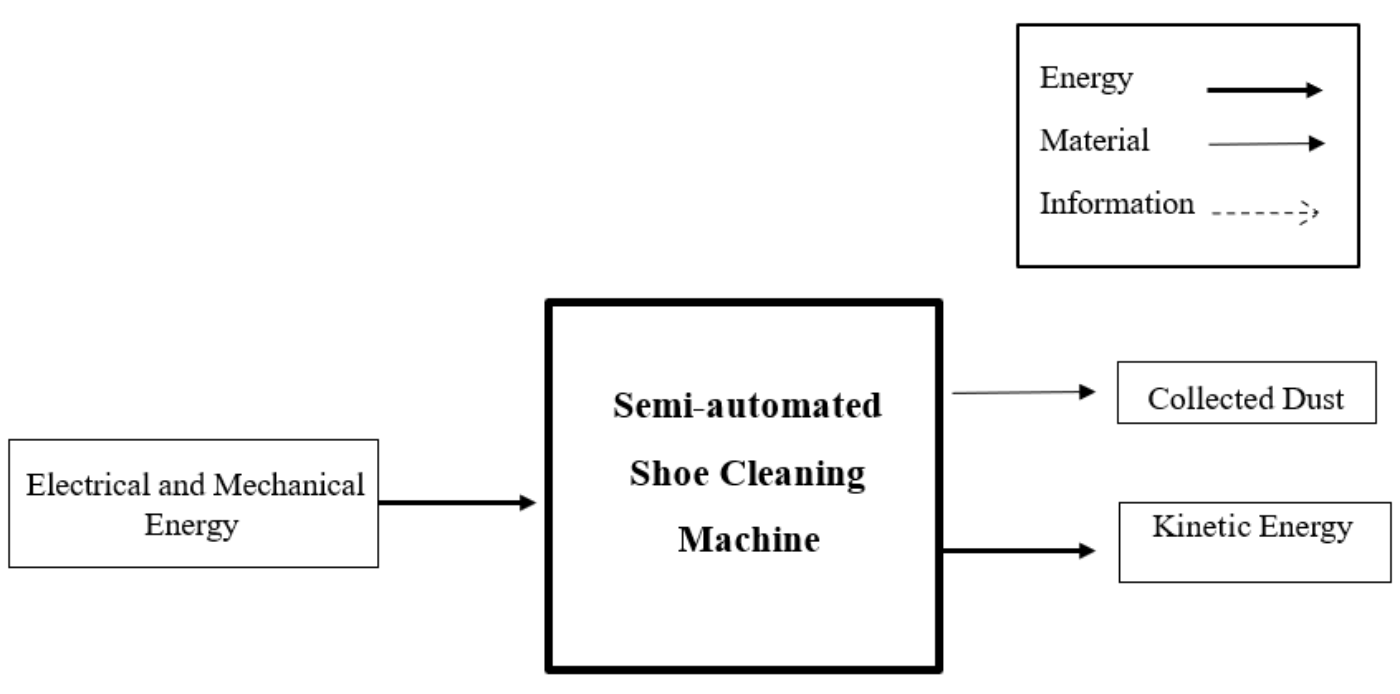
4.3Component Hierarchy
A component hierarchy separates the product into major subassemblies and then lists the components within each one. When the functions of the subassemblies are satisfied, the primary system function is satisfied. Repeating this process creates a function tree that is quick to understand, although it does not fully describe interactions among subassemblies.
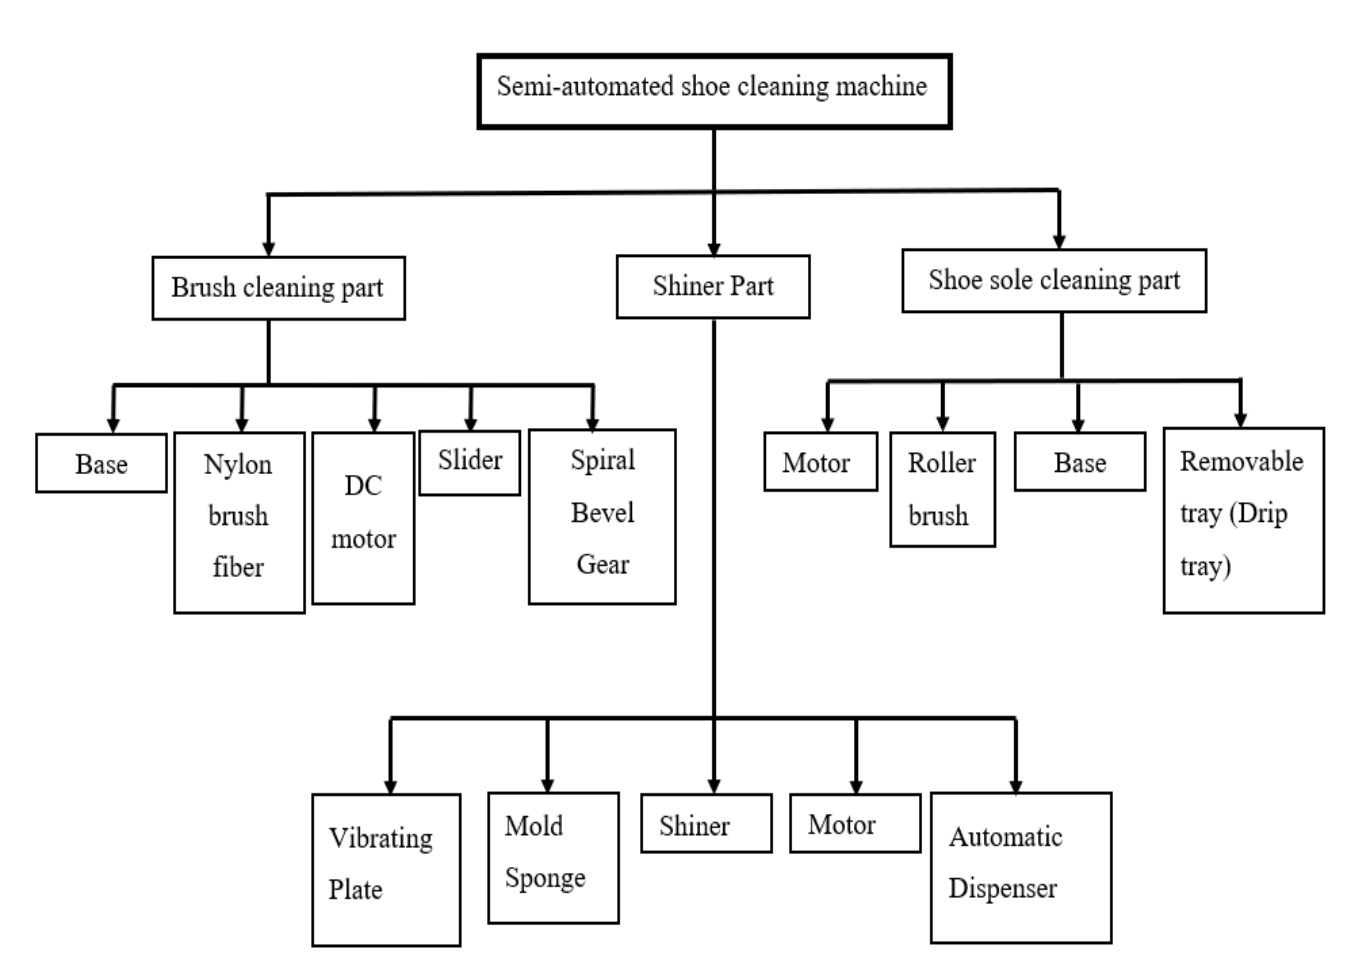
4.4Cluster Function Structure
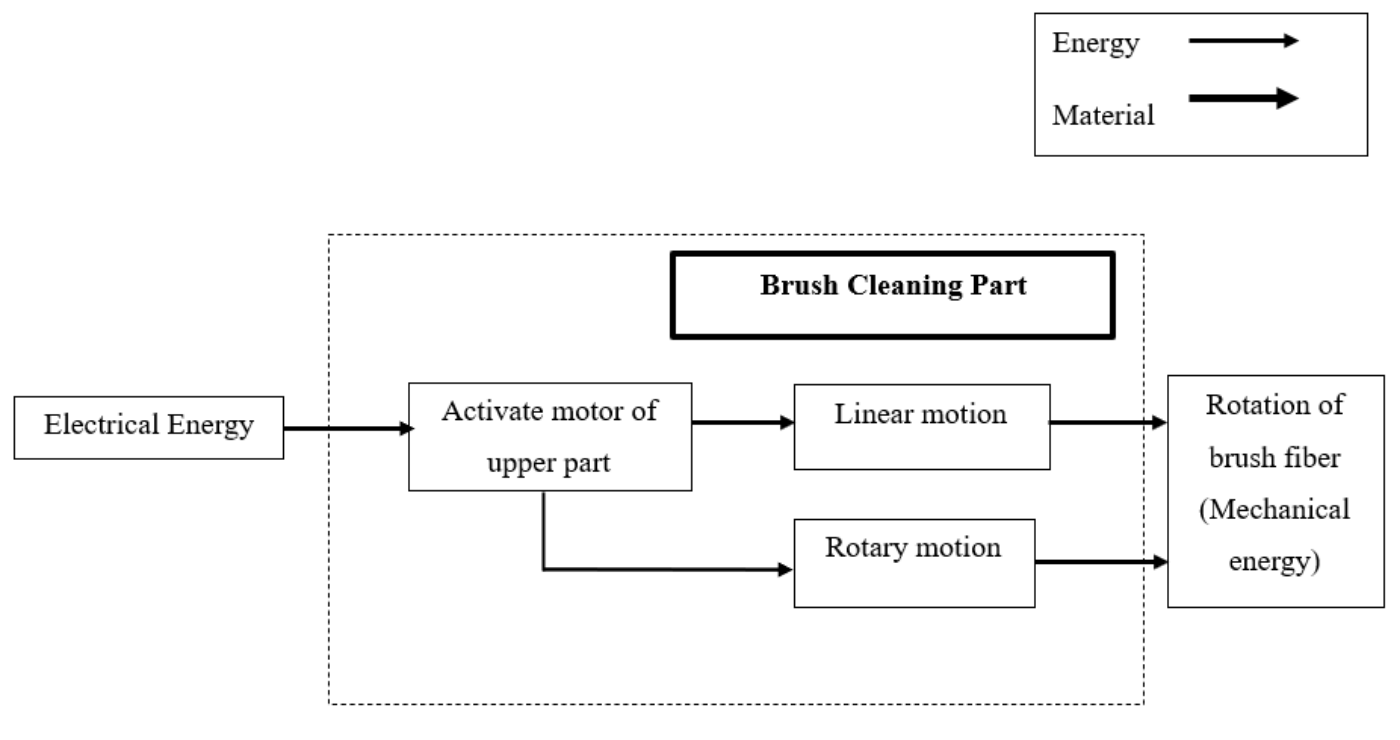
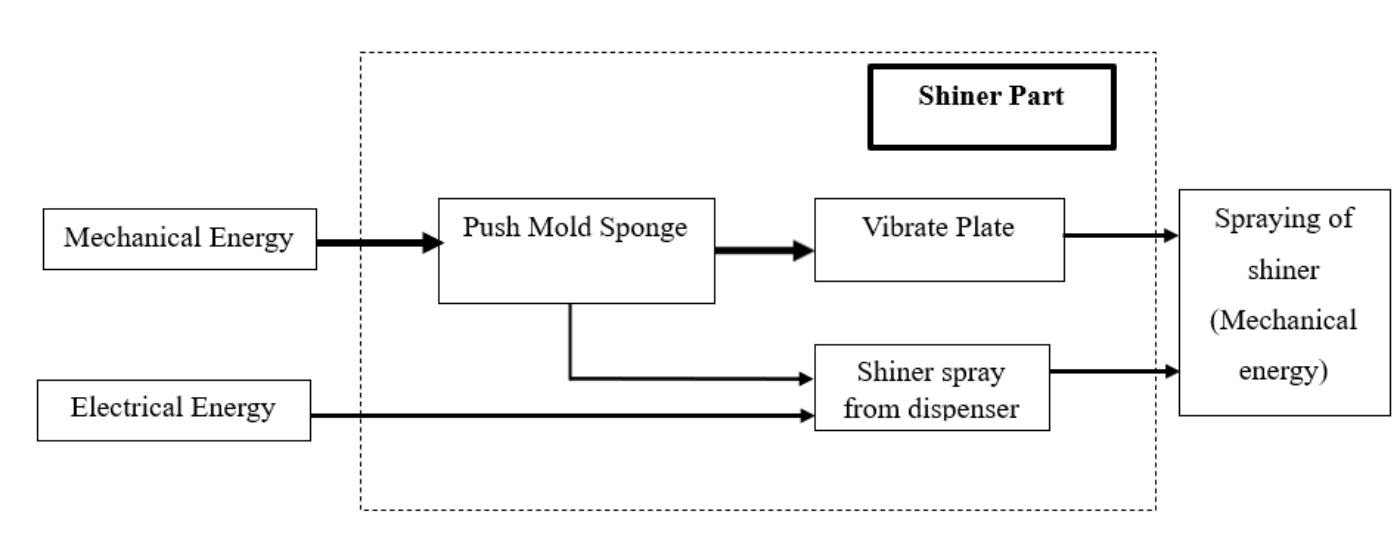
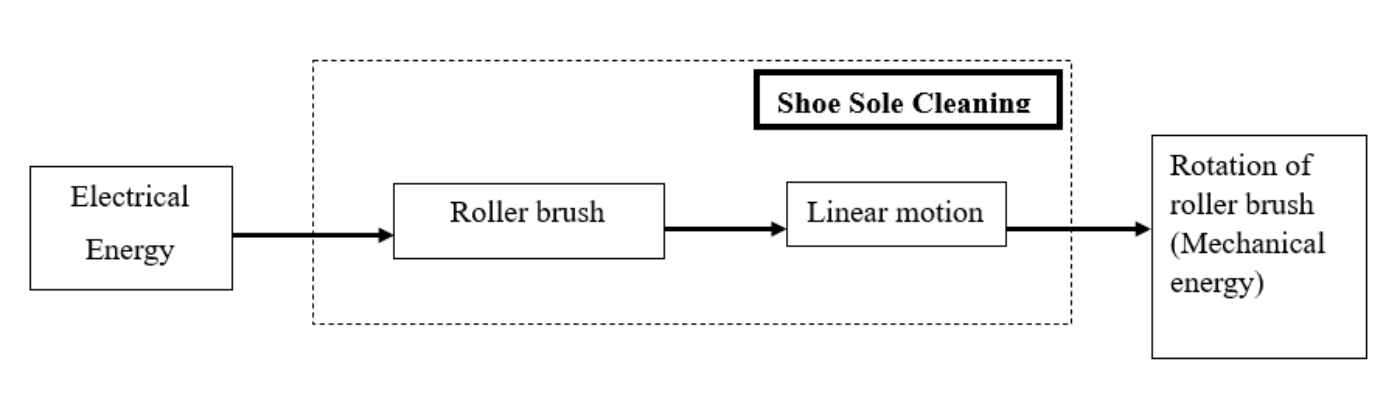
The cluster function structure expands the hierarchy into functional flows. The diagrams below trace how energy and material pass through the brush-cleaning, shining, and shoe-sole-cleaning assemblies.
4.5Conclusion
Together, the black box model, component hierarchy, and cluster function structure provide a complete functional view of the semi-automated shoe cleaning machine. The black box defines the system boundary, the hierarchy identifies each part's role, and the cluster diagrams show how material and energy move through the assemblies.
This progression from system-level purpose to component-level flow supports a well-structured, efficient, functional, and user-friendly design.
Design Analysis
5.1Introduction
The systematic process of designing, which includes tasks such as gathering information, planning, and effective communication, is often referred to as design analysis. Product development is typically divided into several stages, each involving specific activities. These stages frequently require different analyses, such as market research to understand consumer behavior or financial evaluations to identify risks and investment opportunities. In the case of the “Automated Shoe Cleaner,” certain design evaluations are essential to transform the concept into a tangible product.
A critical phase in product development is design analysis, which helps minimize or eliminate reliance on extensive physical prototyping and testing. Through detailed research into customer needs, material selection, manufacturing methods, and assembly processes, a prototype for the “Automated Shoe Cleaner” has been developed. This section will provide an overview of the “Automated Shoe Cleaner” components skillfully designed using SolidWorks software. Additionally, a detailed stress analysis, conducted using Ansys software, will be presented to ensure the product's design is both robust and reliable.
5.2Final Design and Parts of "Semi-Automated Shoe Cleaner"
5.2.1Parts of "Automated Shoe Cleaner"
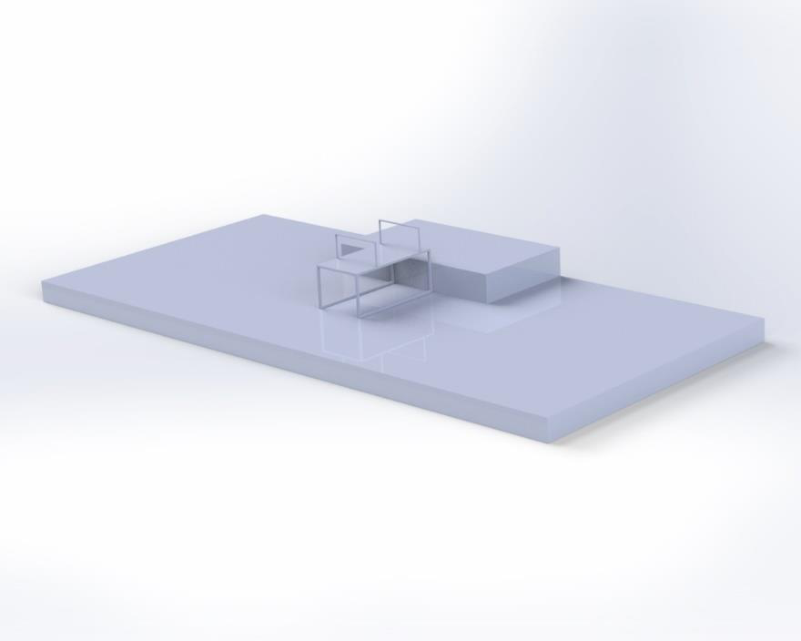
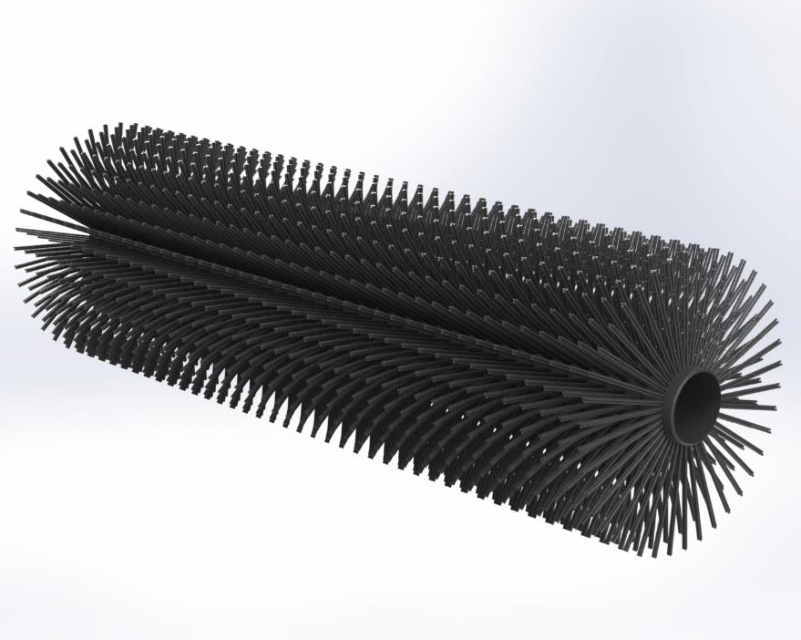
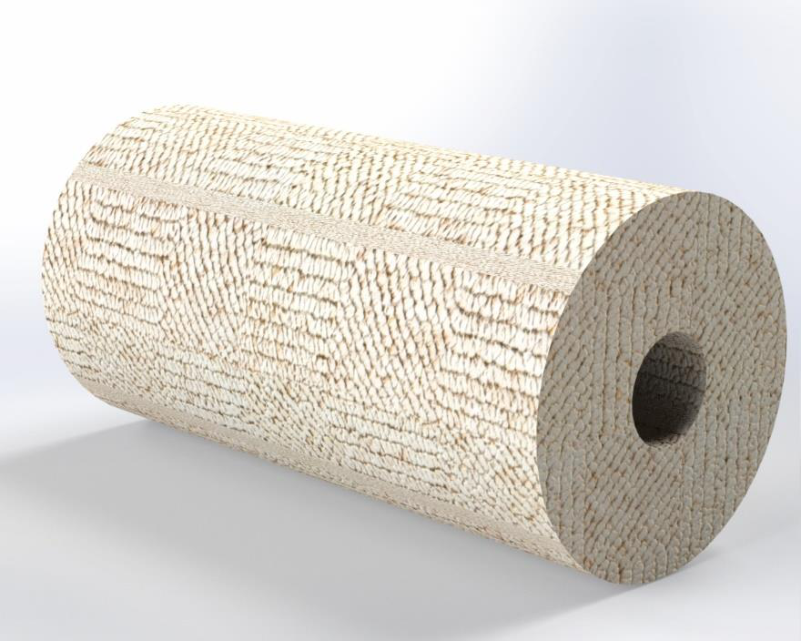
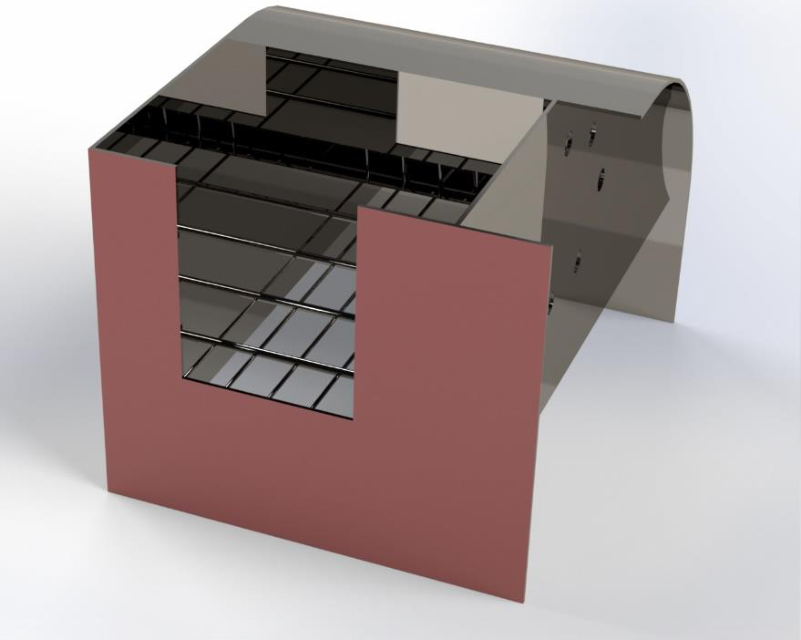
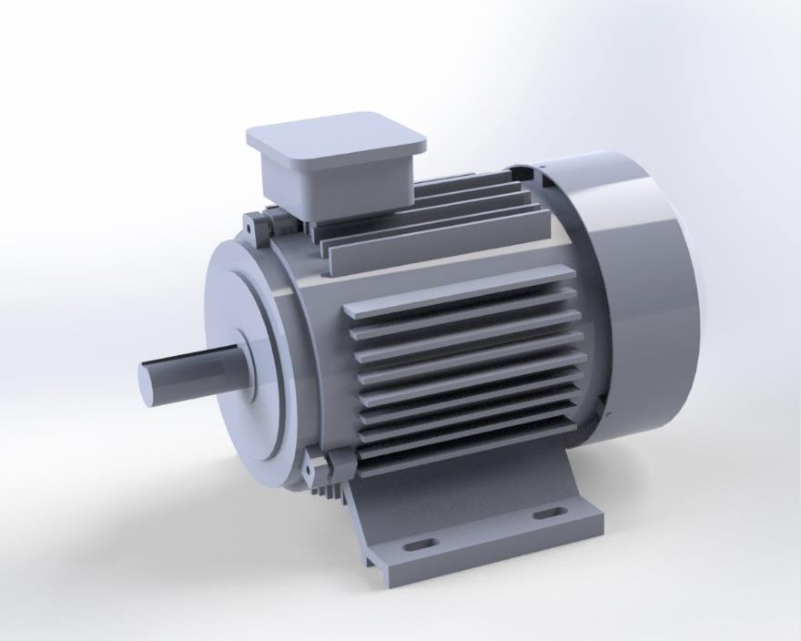
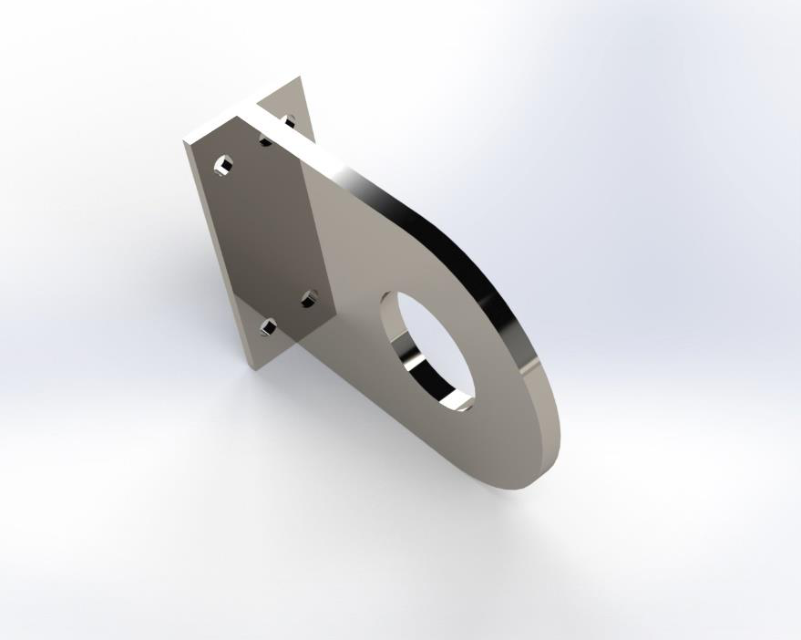
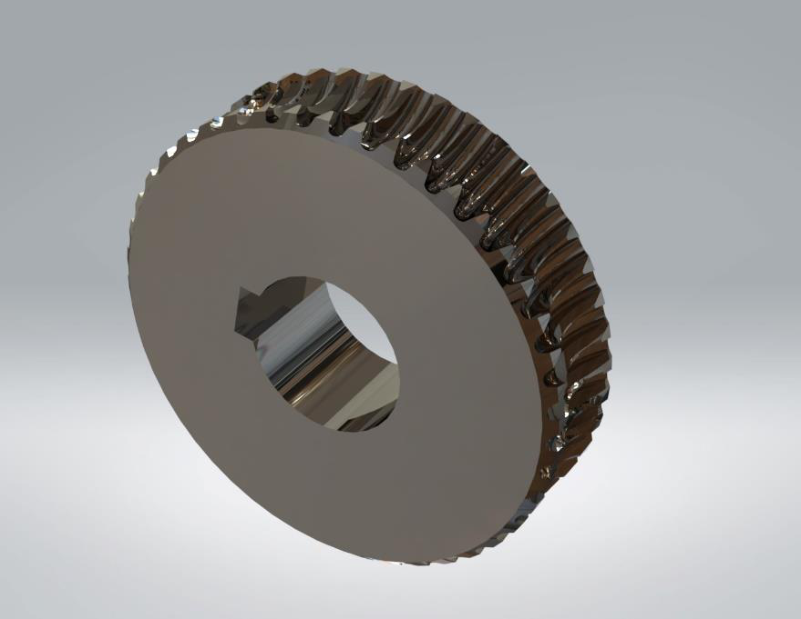
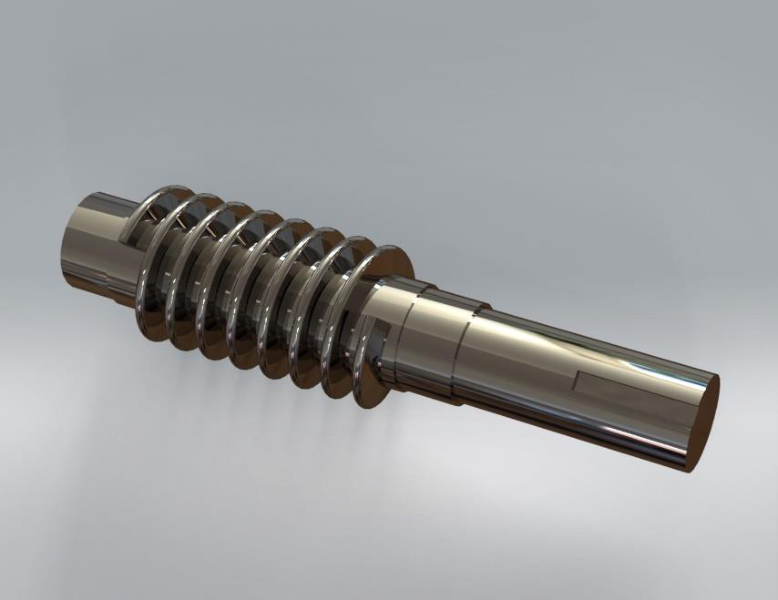
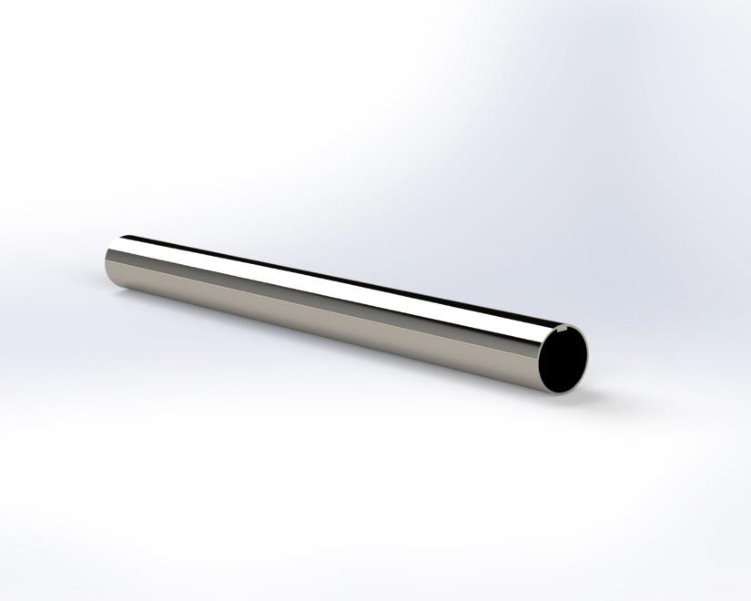
5.2.2Final Design of "semi-Automated shoe Cleaner"
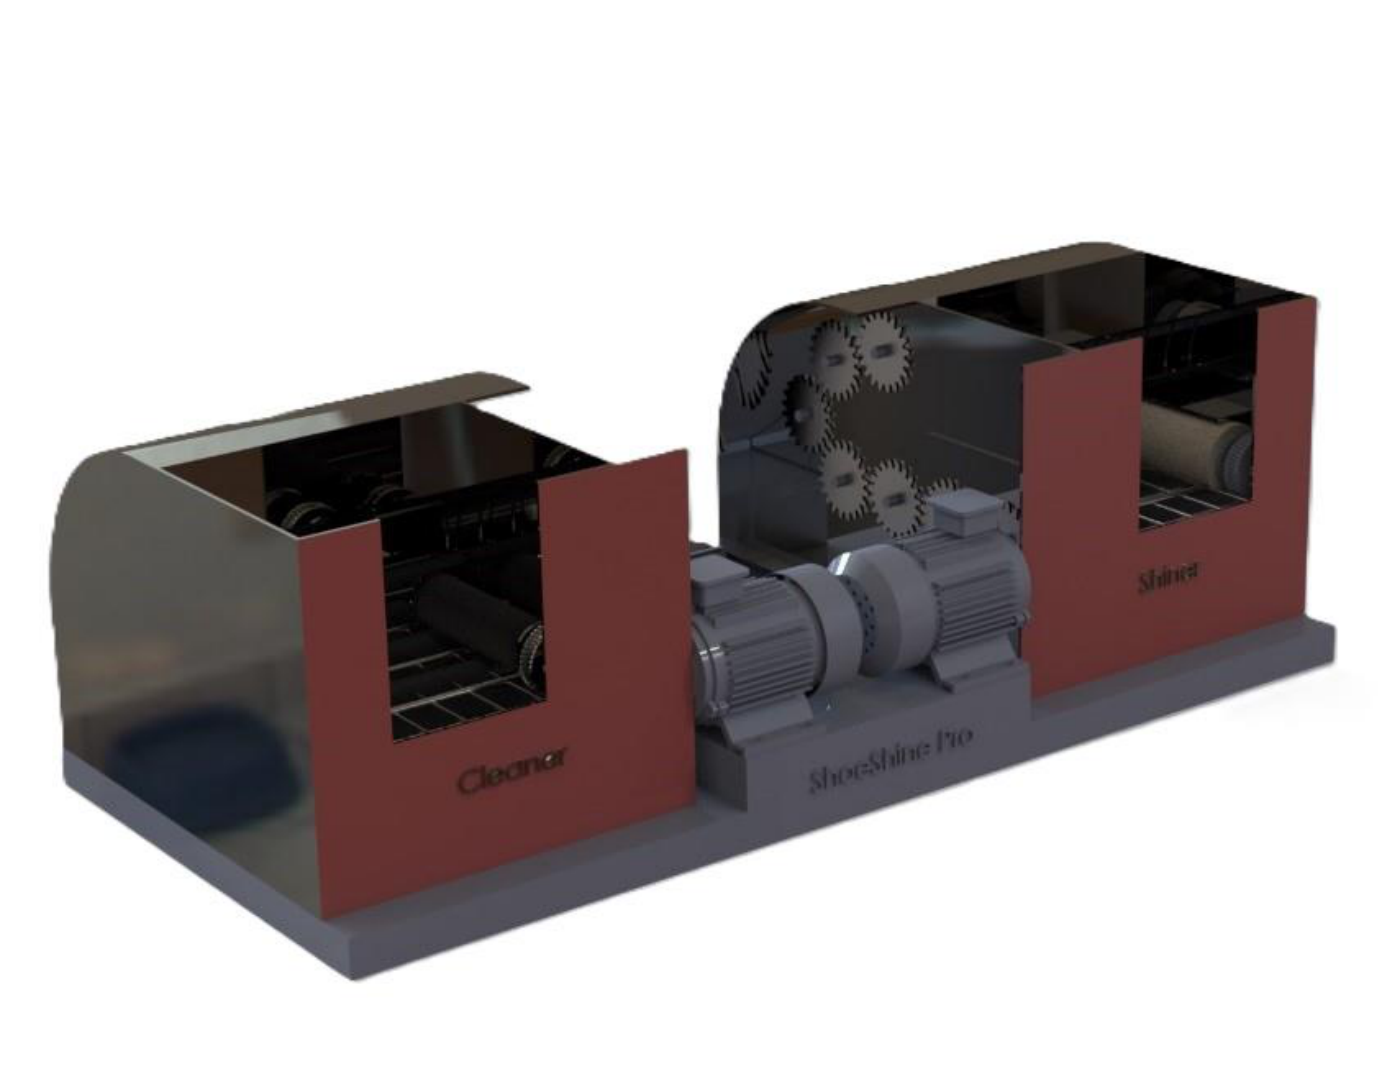
5.3Static Structural Analysis (Ansys) for the proposed design
5.3.1Static Structural Analysis for Base
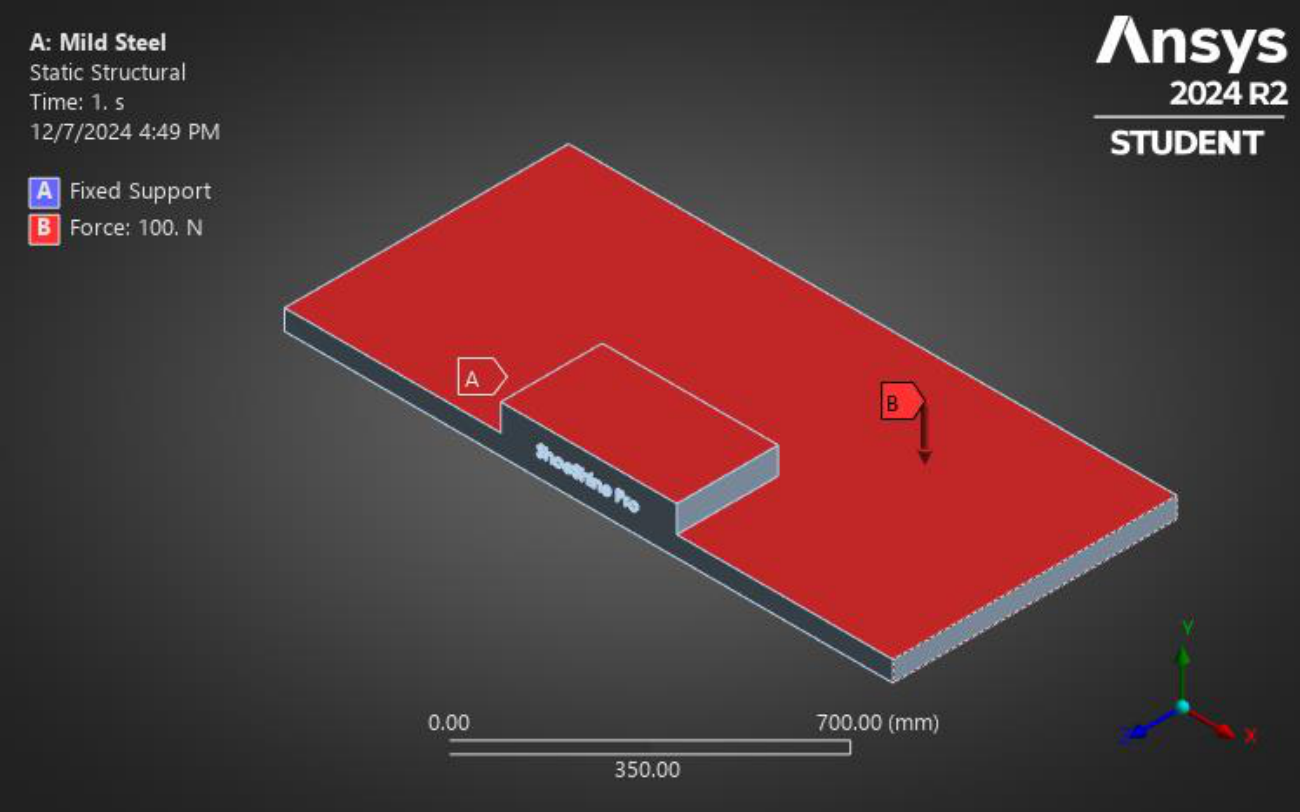
| Types | Force |
|---|---|
| X component | 0N |
| Y component | -100N |
| Z component | 0N |
5.3.1.1Total deformation
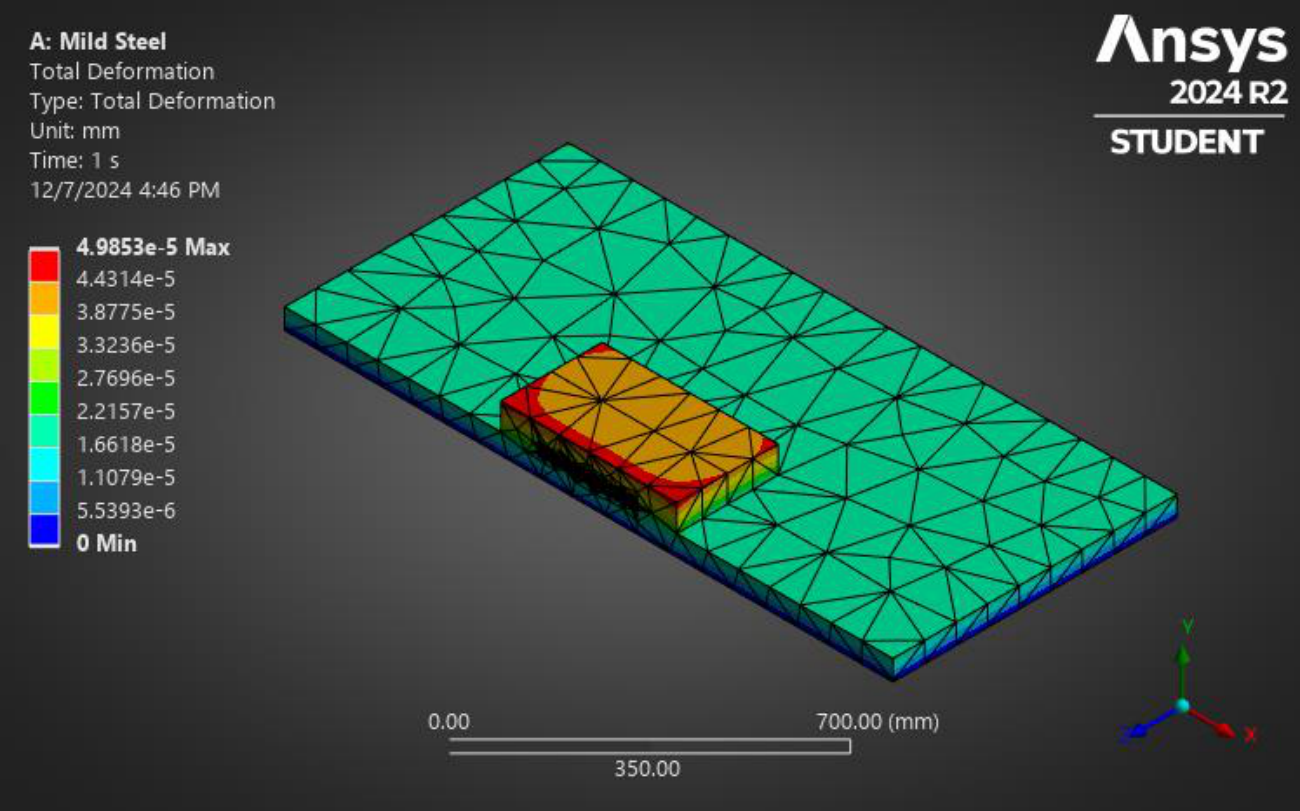
| Name of the Extremity | Total Deformation (mm) |
|---|---|
| Maximum | 4.9853E-5 |
| Minimum | 0 |
5.3.1.2Equivalent Strain of Base
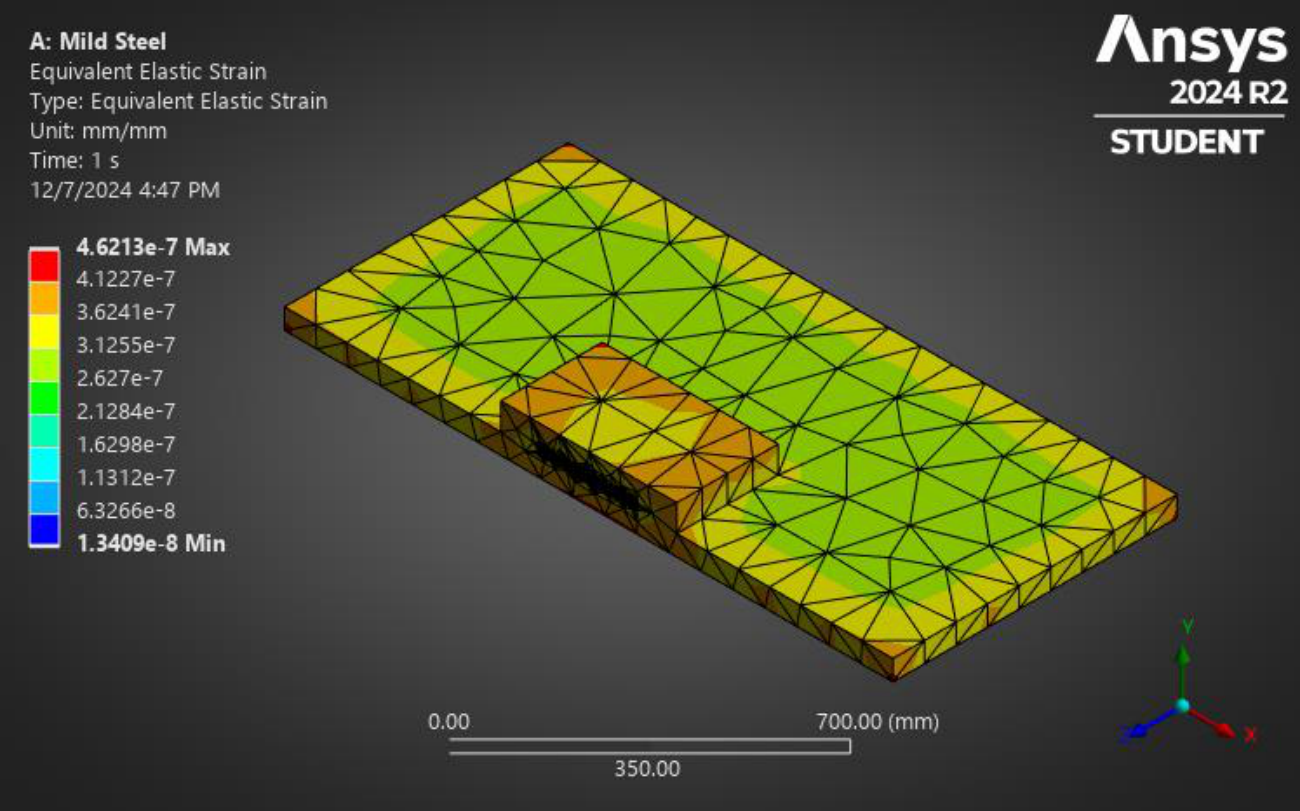
| Name of the Extremity | Equivalent Strain (mm/mm) |
|---|---|
| Maximum | 4.6213E-7 |
| Minimum | 1.3409E-8 |
5.3.1.3Elastic Stress (von-Mises Stress) of Base
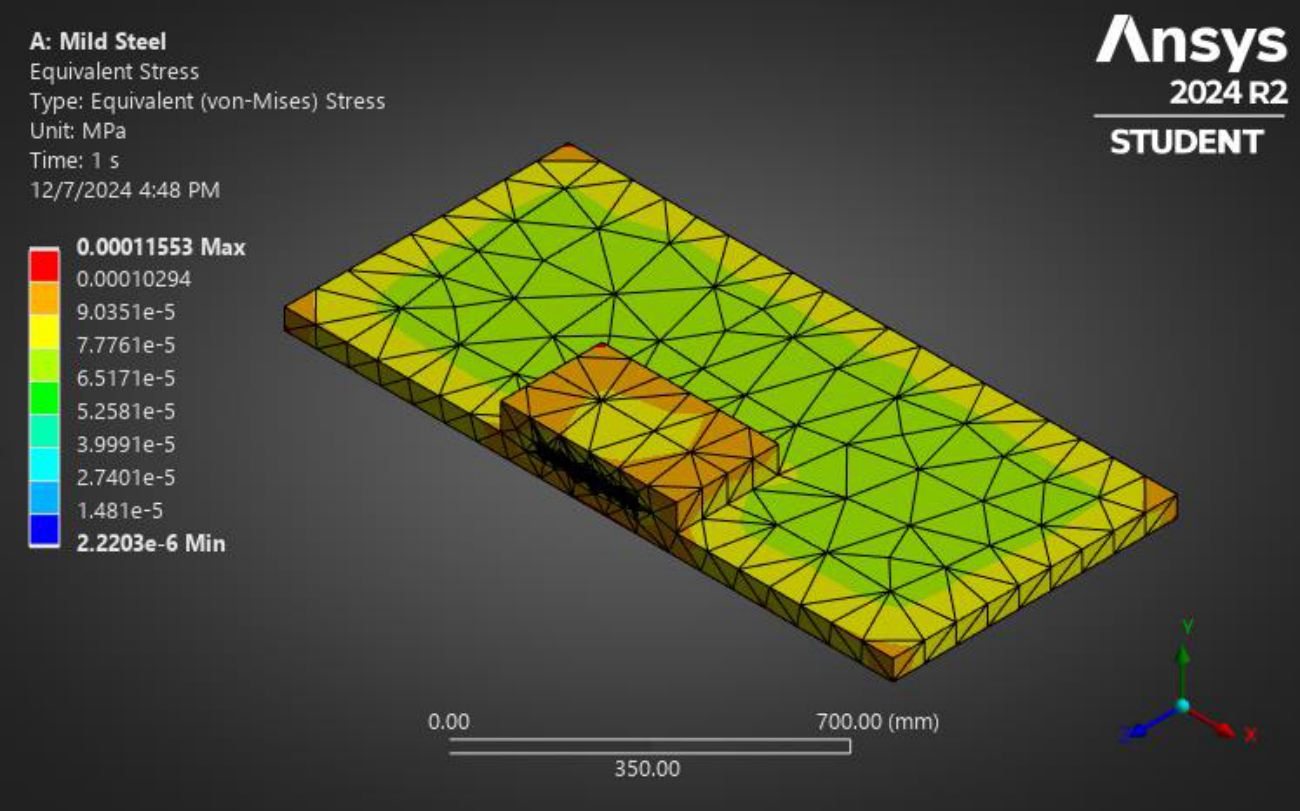
| Name of the Extremity | Equivalent Stress (MPa) |
|---|---|
| Maximum | 0.00011553 |
| Minimum | 2.2203E-6 |
5.3.1.4Safety Factor
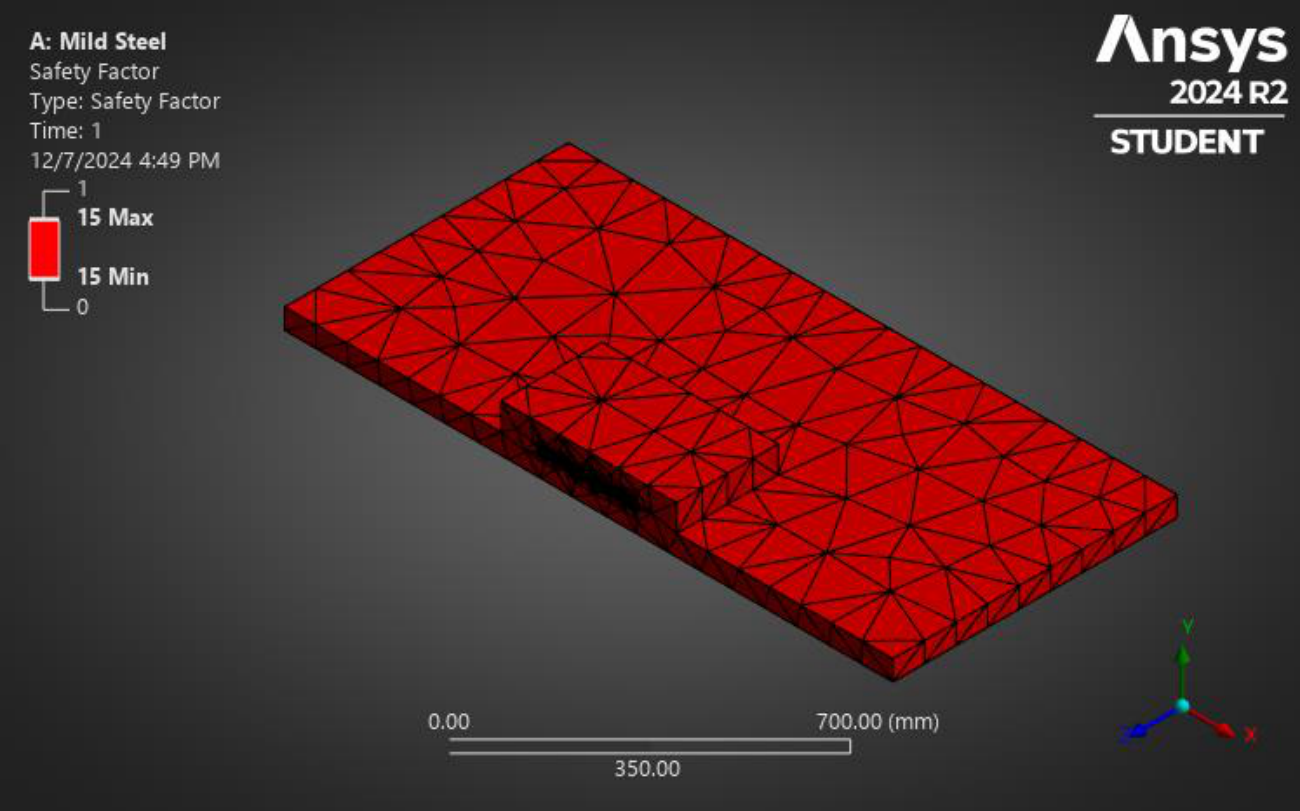
| Name of the Extremity | Safety Factor |
|---|---|
| Maximum | 15 |
| Minimum | 15 |
5.3.1.5Fatigue Life
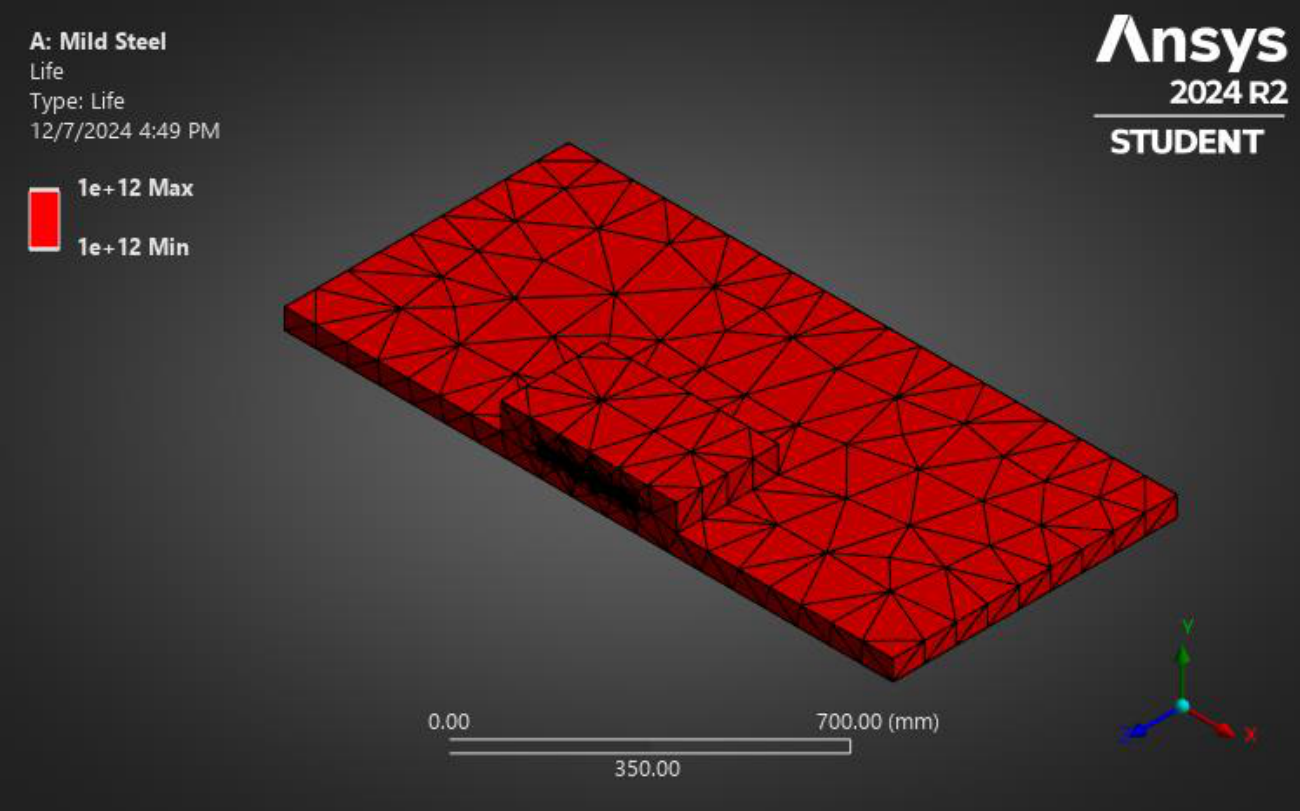
| Name of the Extremity | Fatigue Life |
|---|---|
| Maximum | 1E+12 |
| Minimum | 1E+12 |
5.3.2Static Structural Analysis for Frame
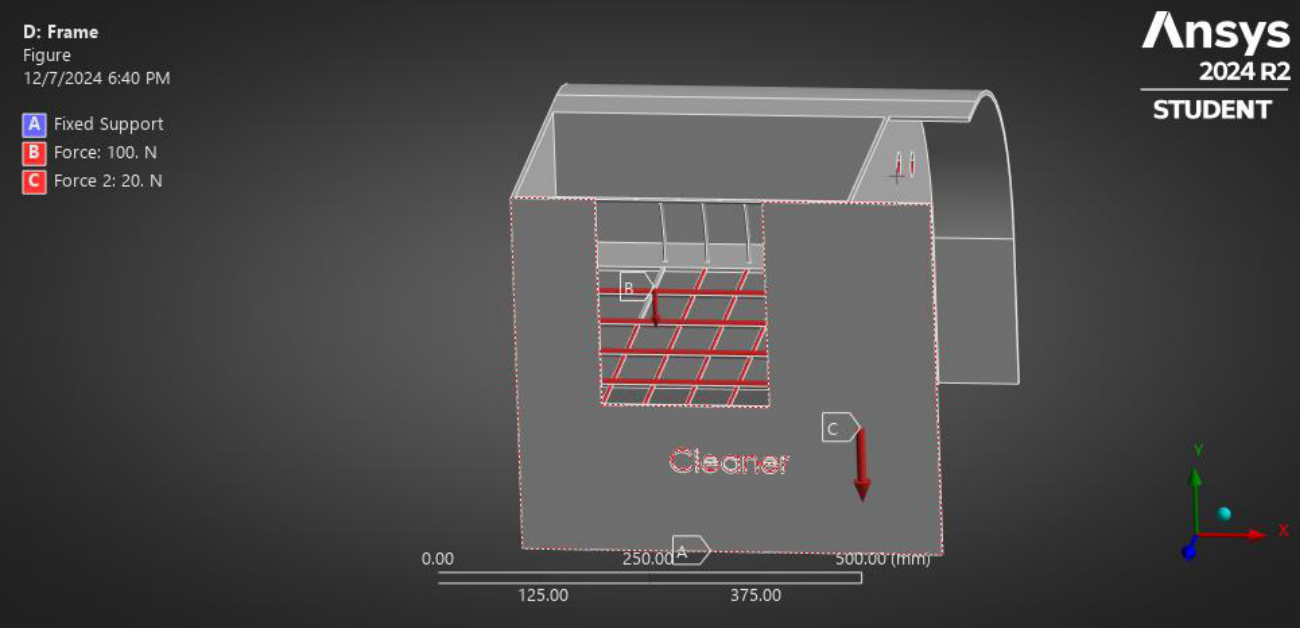
| Types | Force |
|---|---|
| X component | 0N |
| Y component | -120N |
| Z component | 0N |
5.3.2.1Total deformation
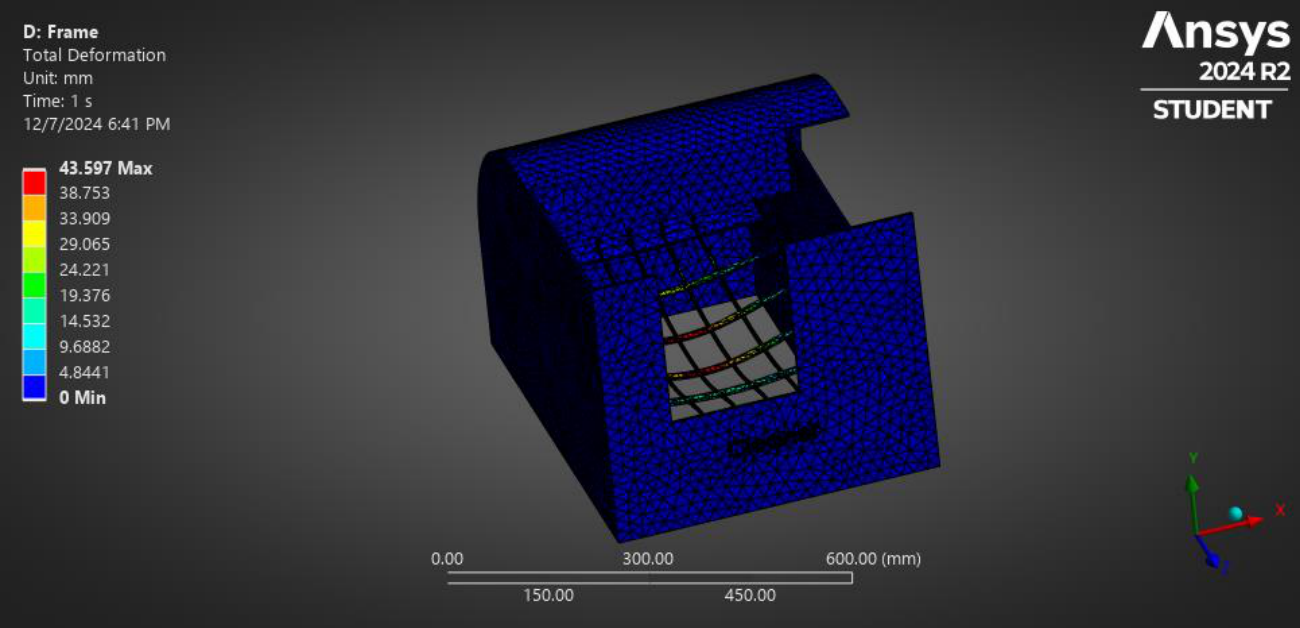
| Name of the Extremity | Total Deformation (mm) |
|---|---|
| Maximum | 43.597 |
| Minimum | 0 |
5.3.2.2Equivalent Strain of Frame
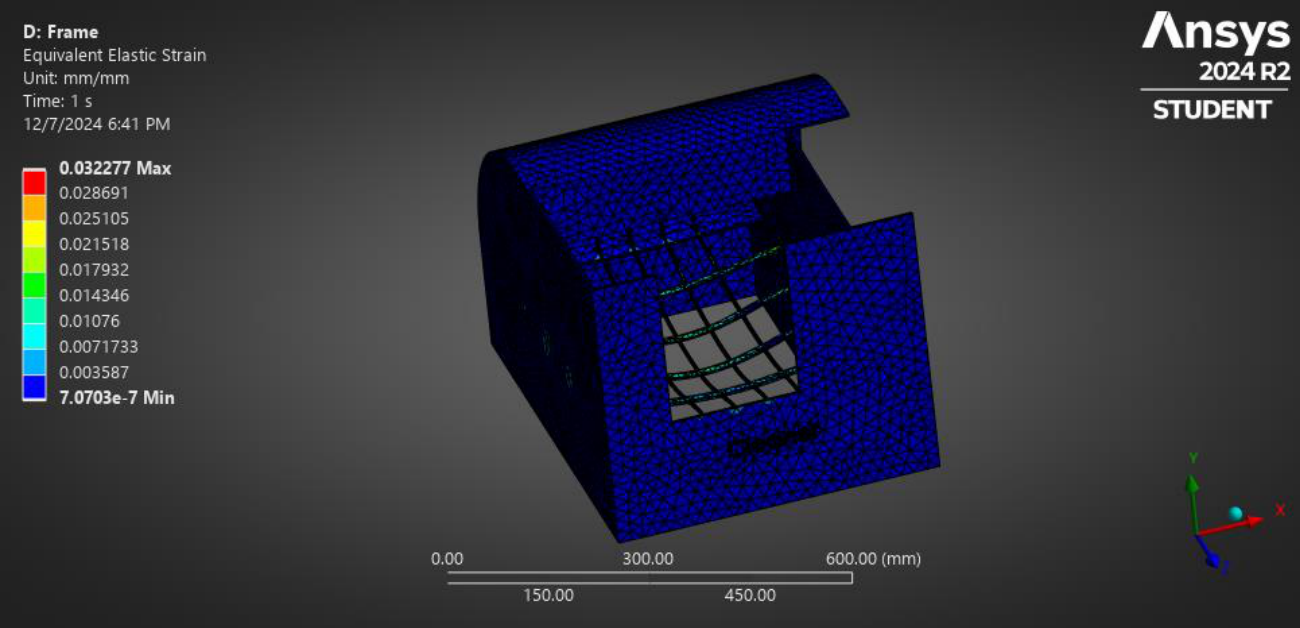
| Name of the Extremity | Equivalent Strain (mm/mm) |
|---|---|
| Maximum | 0.032277 |
| Minimum | 7.0703E-7 |
5.3.2.3Equivalent Elastic Stress (von Mises Stress)
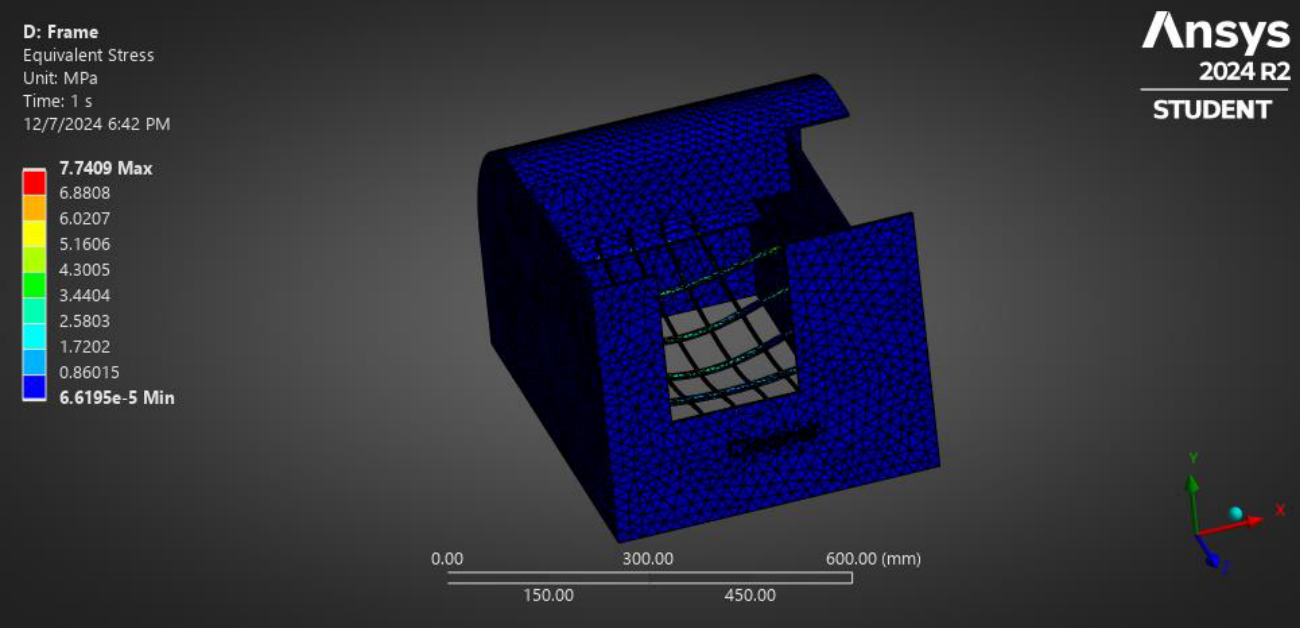
| Name of the Extremity | Equivalent Stress (MPa) |
|---|---|
| Maximum | 7.7409 |
| Minimum | 6.6195E-5 |
5.3.2.4Safety Factor
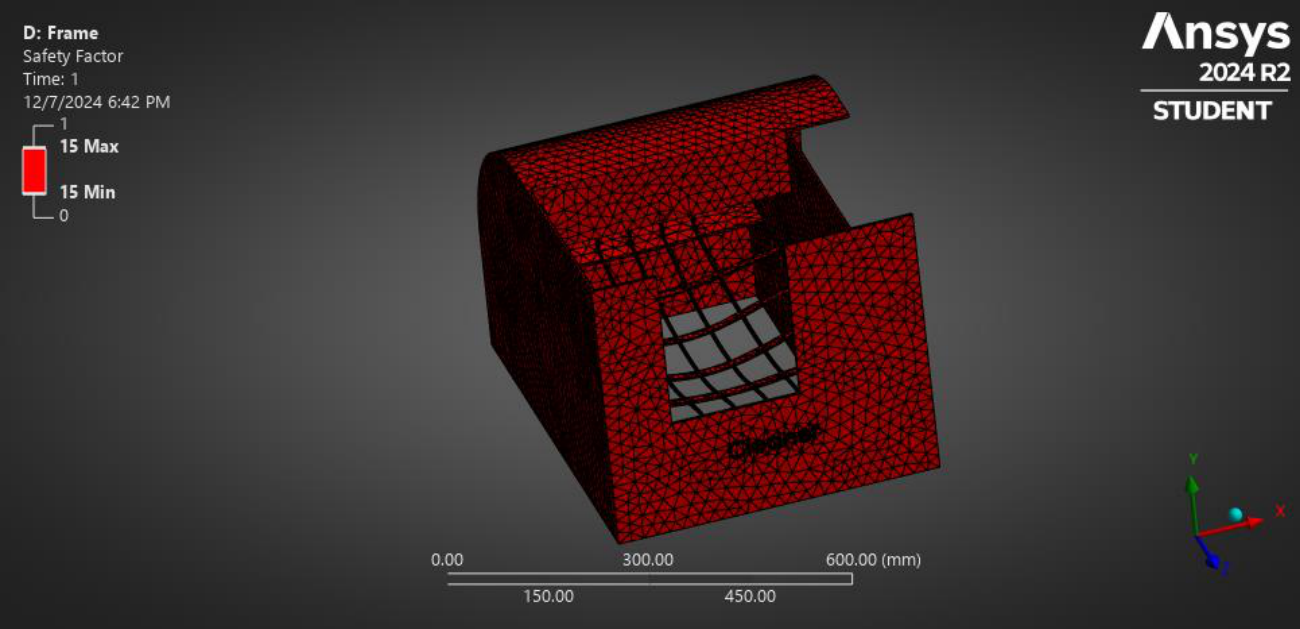
| Name of the Extremity | Safety Factor |
|---|---|
| Maximum | 15 |
| Minimum | 15 |
5.3.2.5Fatigue Life
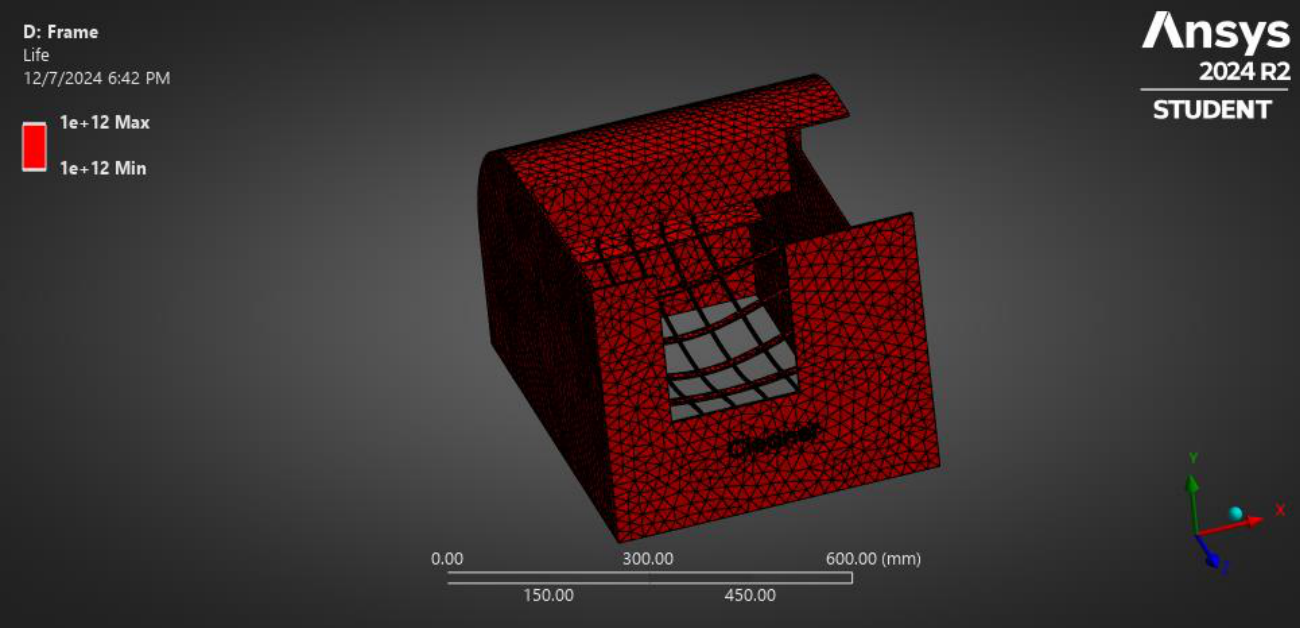
| Name of the Extremity | Fatigue Life |
|---|---|
| Maximum | 1E+12 |
| Minimum | 1E+12 |
5.3.3Static Structural Analysis for Shaft
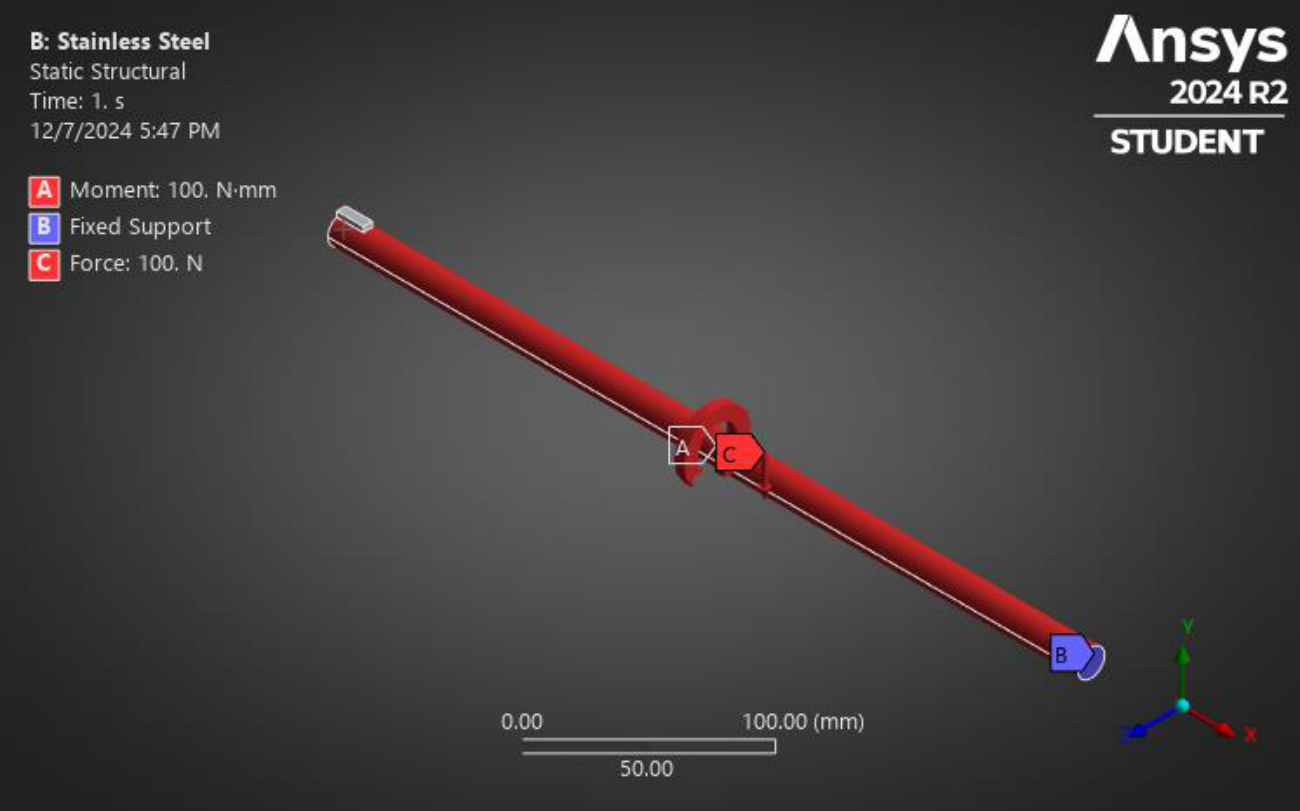
| Types | Force(N)/ Moment (N.mm) |
|---|---|
| X component | 100N.mm |
| Y component | -100N |
| Z component | 0N |
5.3.3.1Total deformation
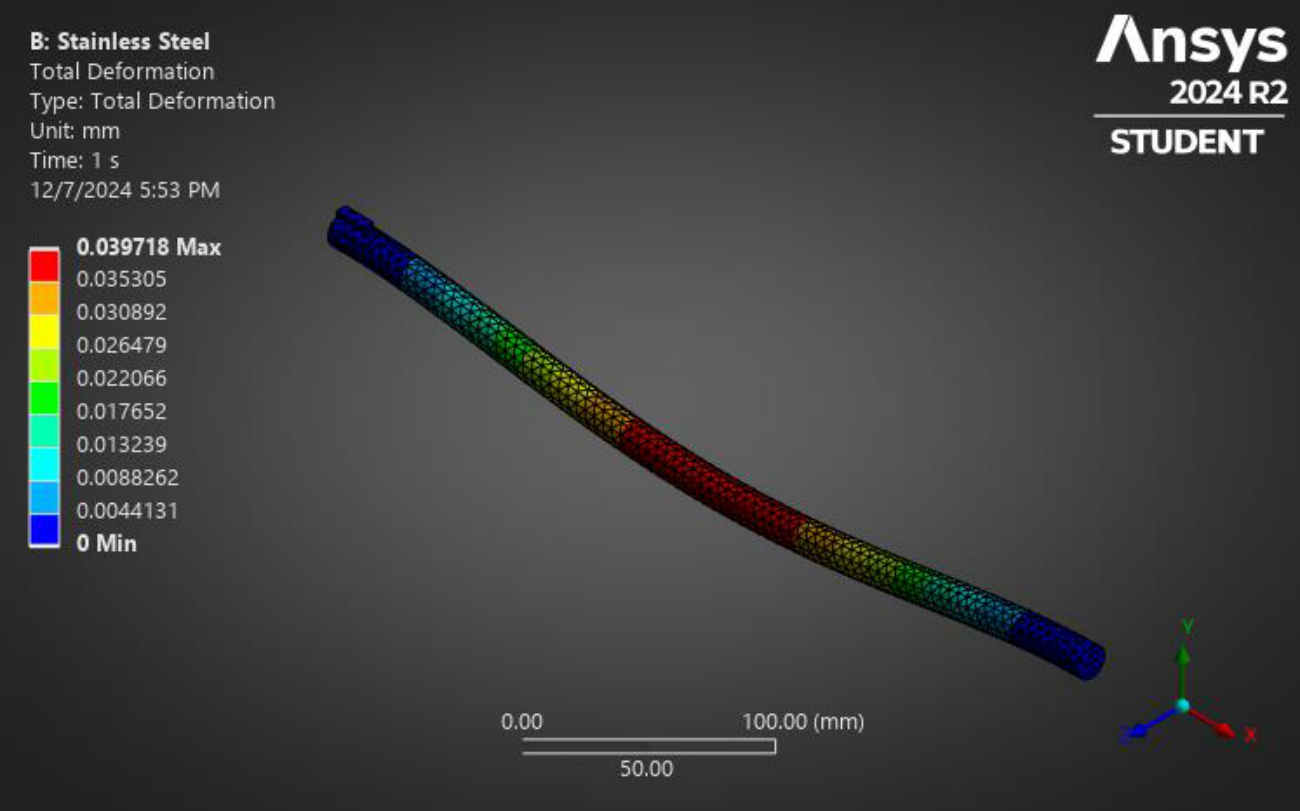
| Name of the Extremity | Total Deformation (mm) |
|---|---|
| Maximum | 0.039718 |
| Minimum | 0 |
5.3.3.2Equivalent Strain
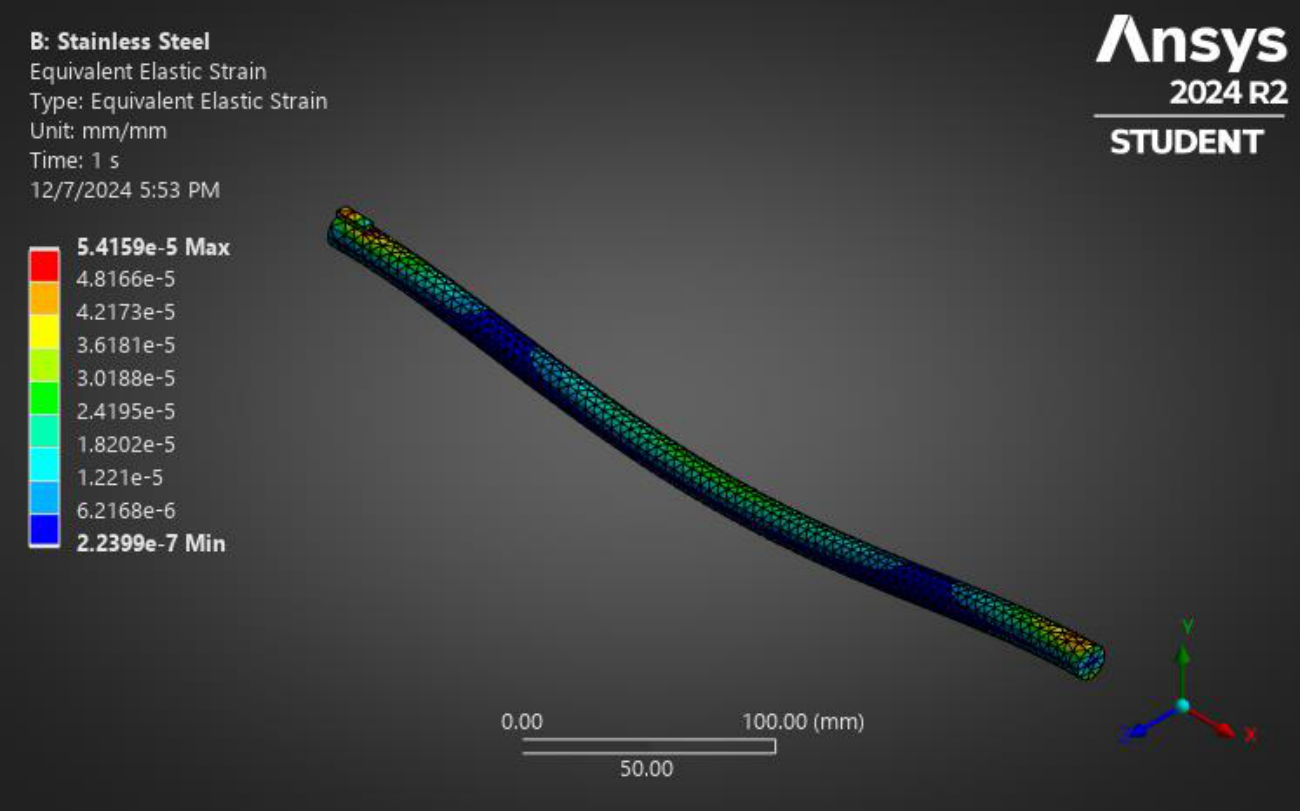
| Name of the Extremity | Equivalent Strain (mm/mm) |
|---|---|
| Maximum | 5.4159E-5 |
| Minimum | 2.2399E-7 |
5.3.3.3Equivalent Elastic Stress (von Mises Stress)
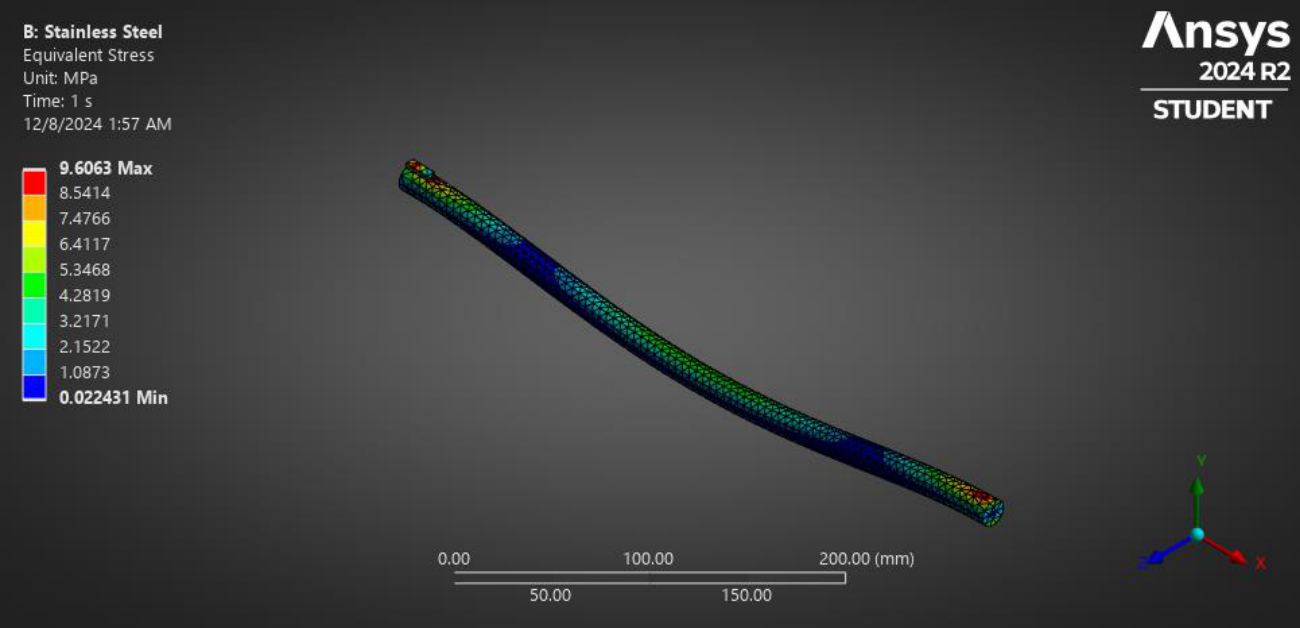
| Name of the Extremity | Equivalent Stress (MPa) |
|---|---|
| Maximum | 9.6063 |
| Minimum | 0.022431 |
5.3.3.4Safety Factor
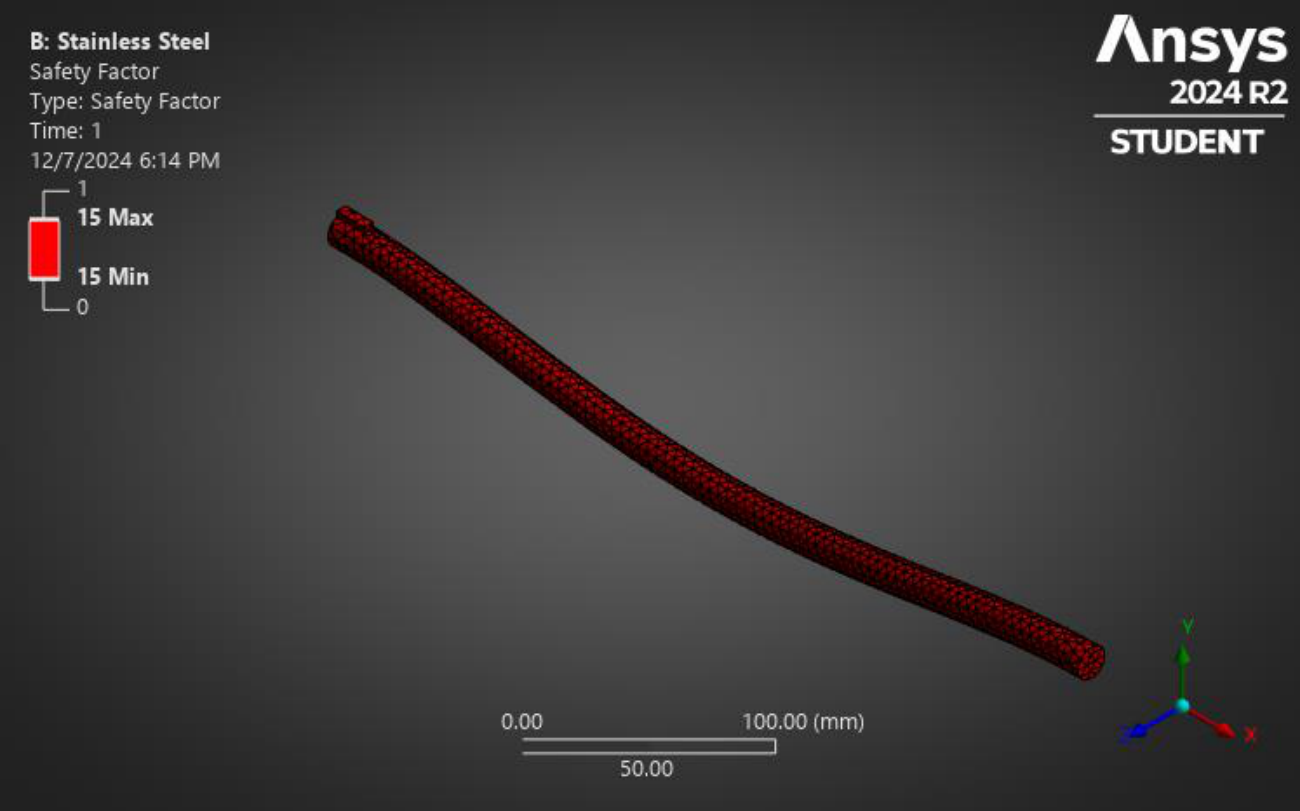
| Name of the Extremity | Safety Factor |
|---|---|
| Maximum | 15 |
| Minimum | 15 |
5.3.3.5Fatigue Life
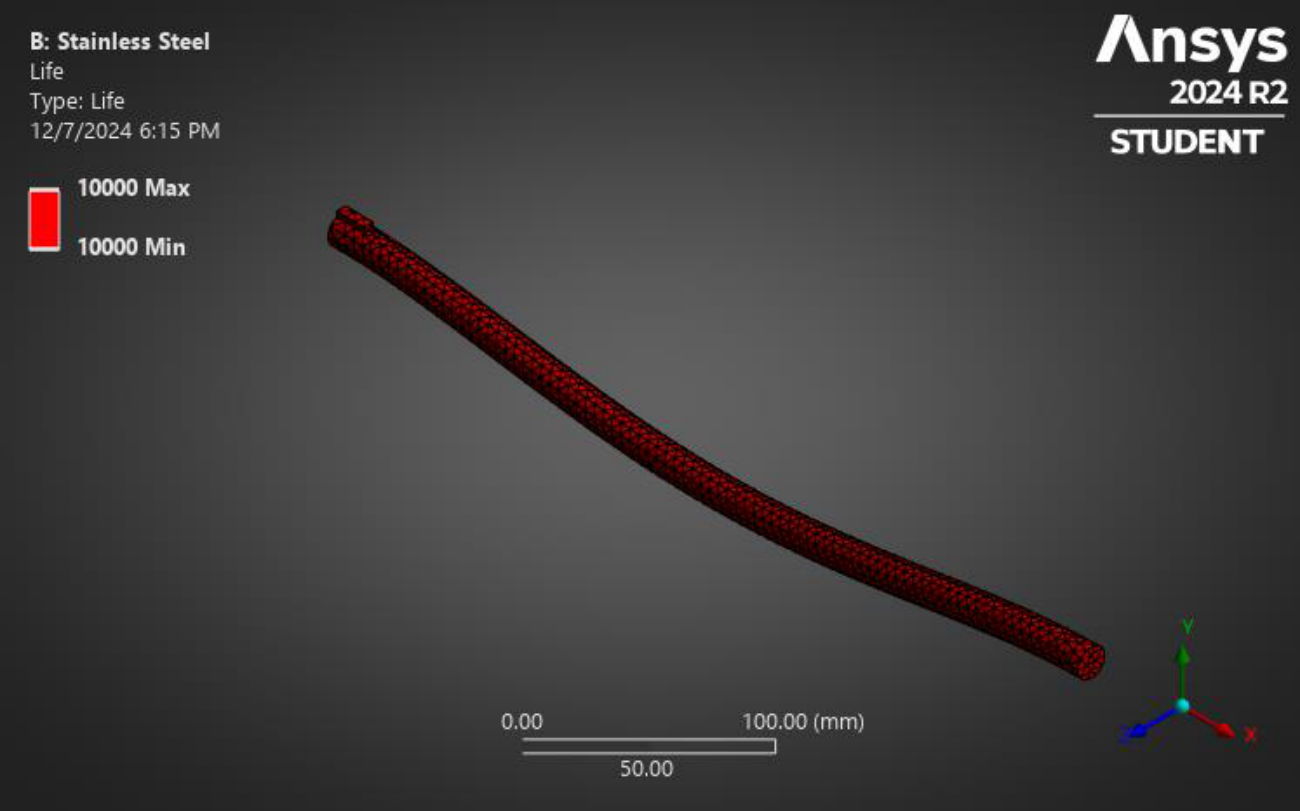
| Name of the Extremity | Fatigue Life |
|---|---|
| Maximum | 10000 |
| Minimum | 10000 |
5.3.4Static Structural Analysis for Worm-Gear Connector
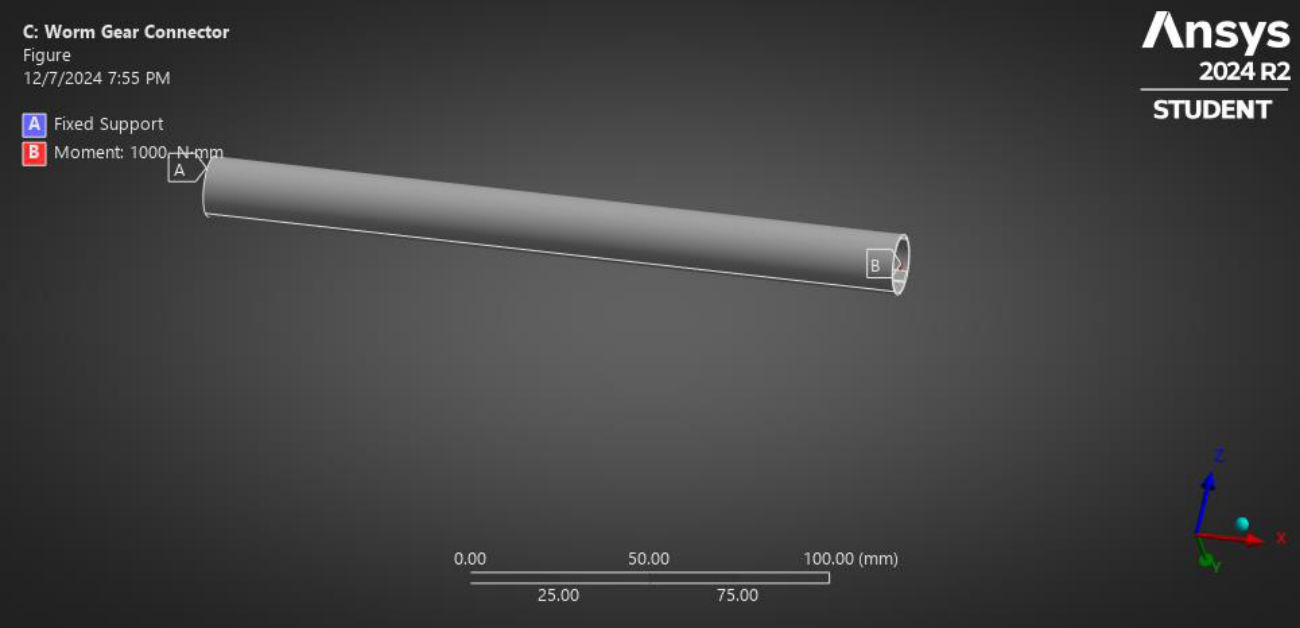
| Types | Force(N)/ Moment (N.mm) |
|---|---|
| X component | 1000N.mm |
| Y component | 0N |
| Z component | 0N |
5.3.4.1Total deformation
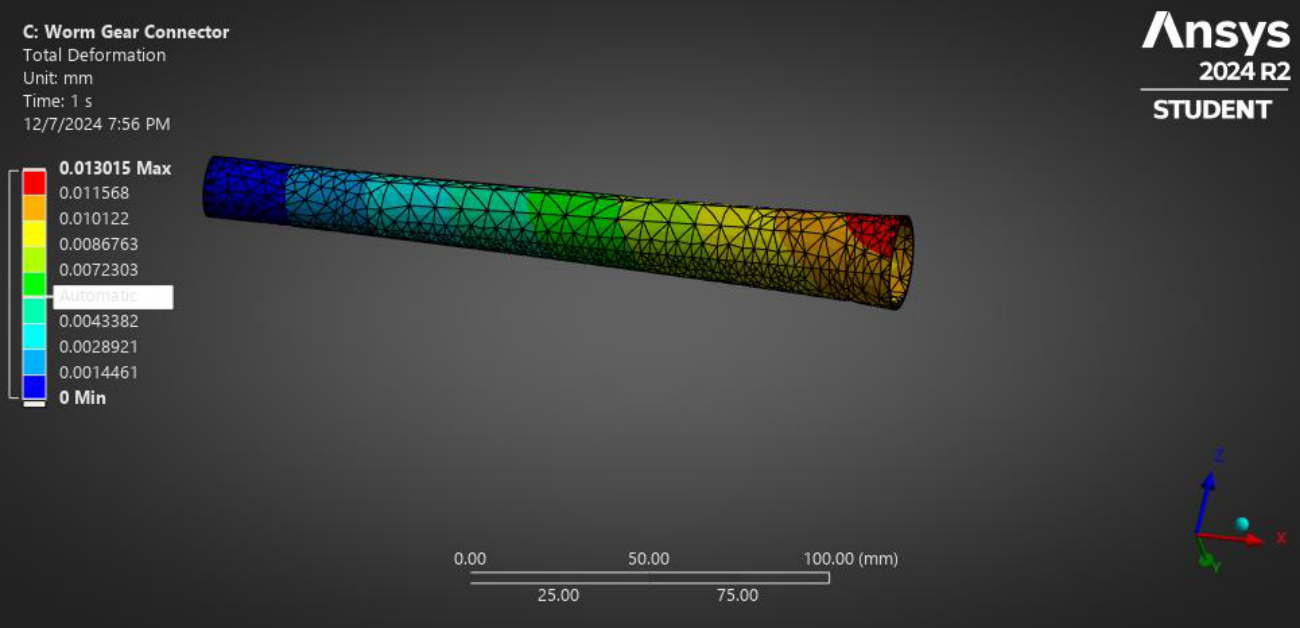
| Name of the Extremity | Total Deformation (mm) |
|---|---|
| Maximum | 0.013015 |
| Minimum | 0 |
5.3.4.2Equivalent Strain
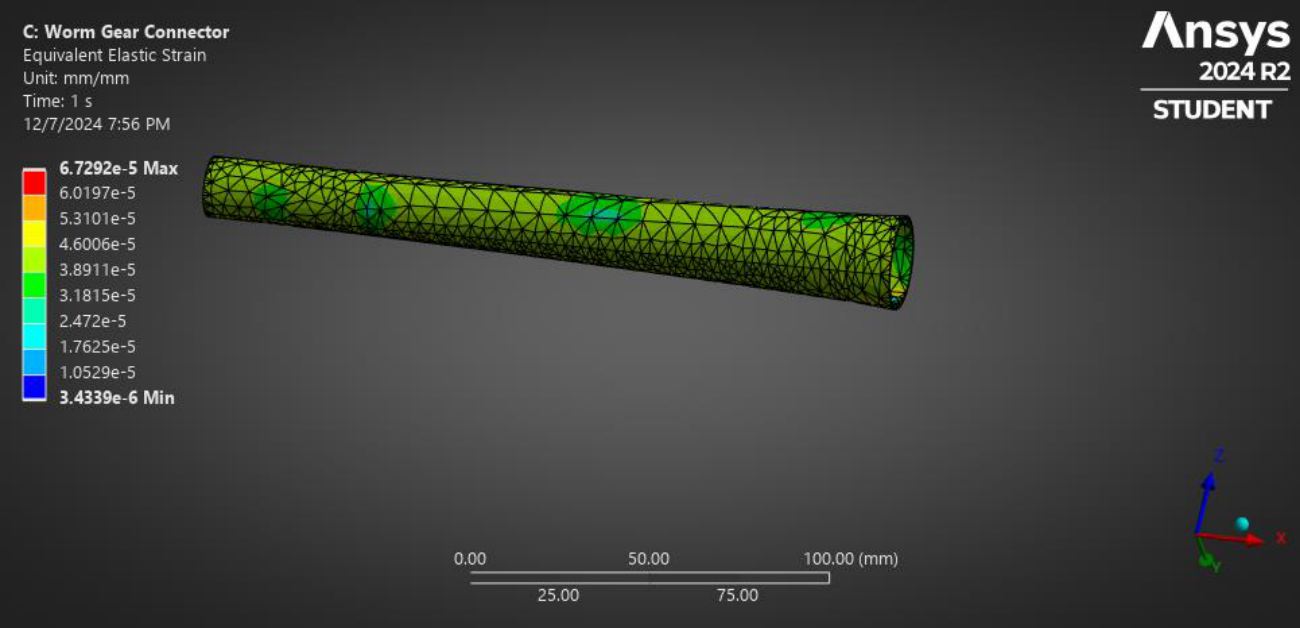
| Name of the Extremity | Equivalent Strain (mm/mm) |
|---|---|
| Maximum | 6.7292E-5 |
| Minimum | 3.4339E-6 |
5.3.4.3Equivalent Elastic Stress (von Mises Stress)
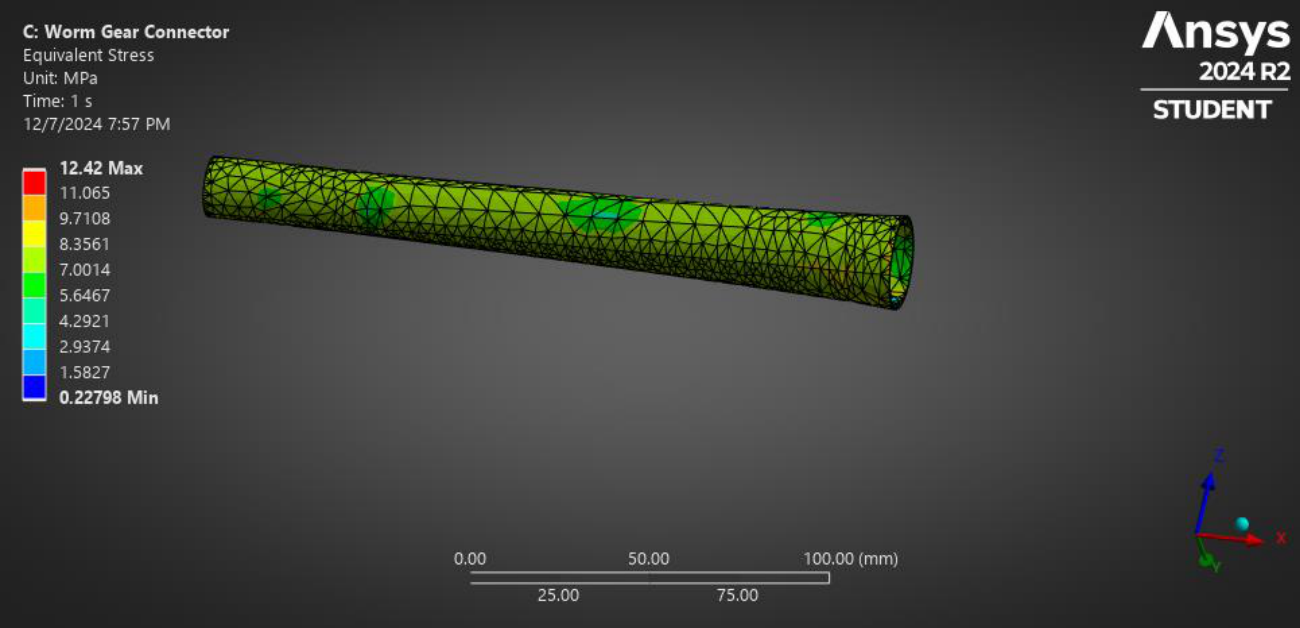
| Name of the Extremity | Equivalent Stress (MPa) |
|---|---|
| Maximum | 12.42 |
| Minimum | 0.22798 |
5.3.4.4Safety Factor
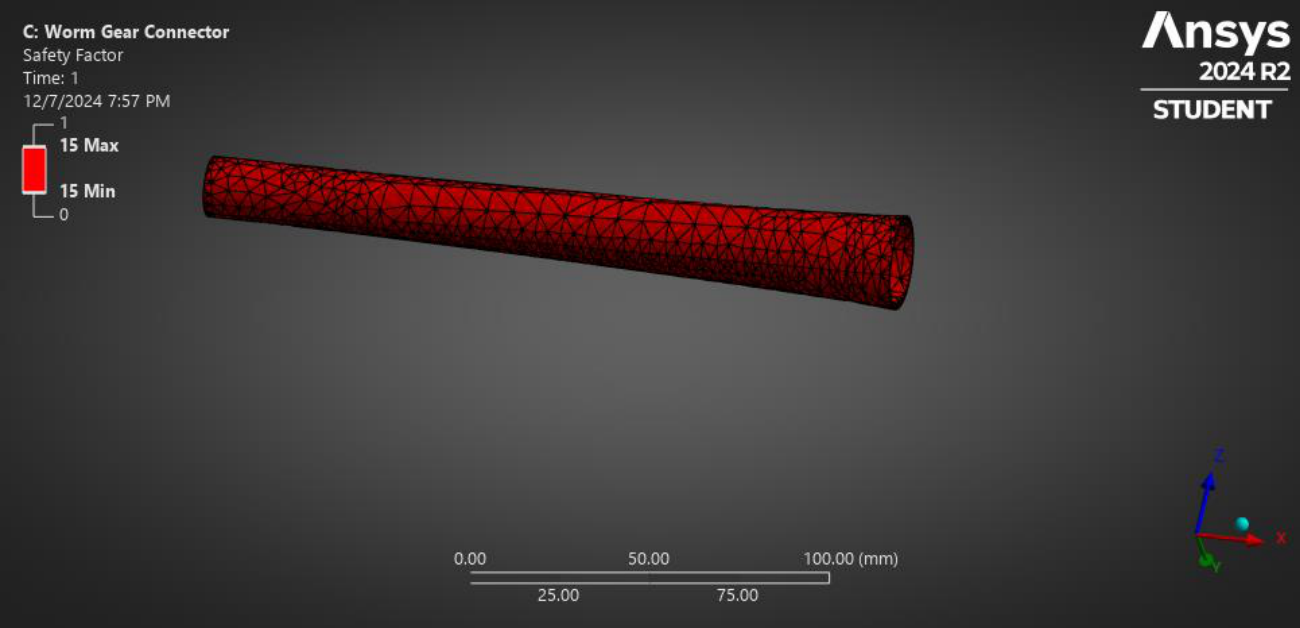
| Name of the Extremity | Safety Factor |
|---|---|
| Maximum | 15 |
| Minimum | 15 |
5.3.4.5Fatigue Life
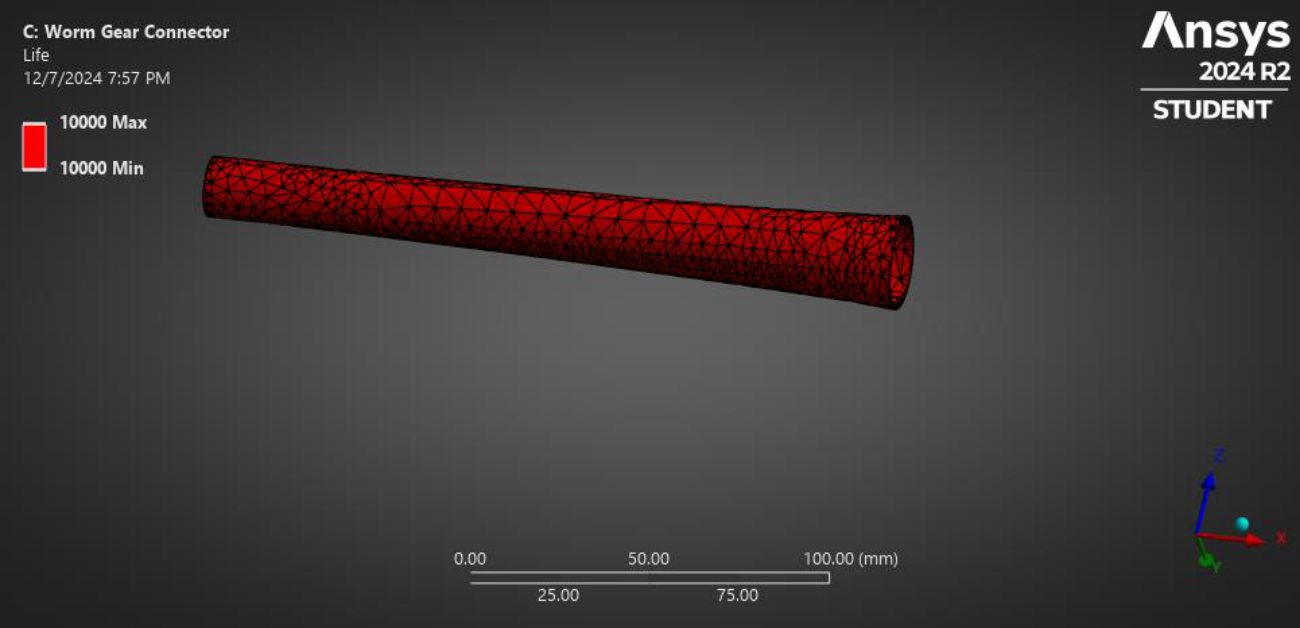
| Name of the Extremity | Fatigue Life |
|---|---|
| Maximum | 10000 |
| Minimum | 10000 |
5.3.5Static Structural Analysis for Side-Brush-Support
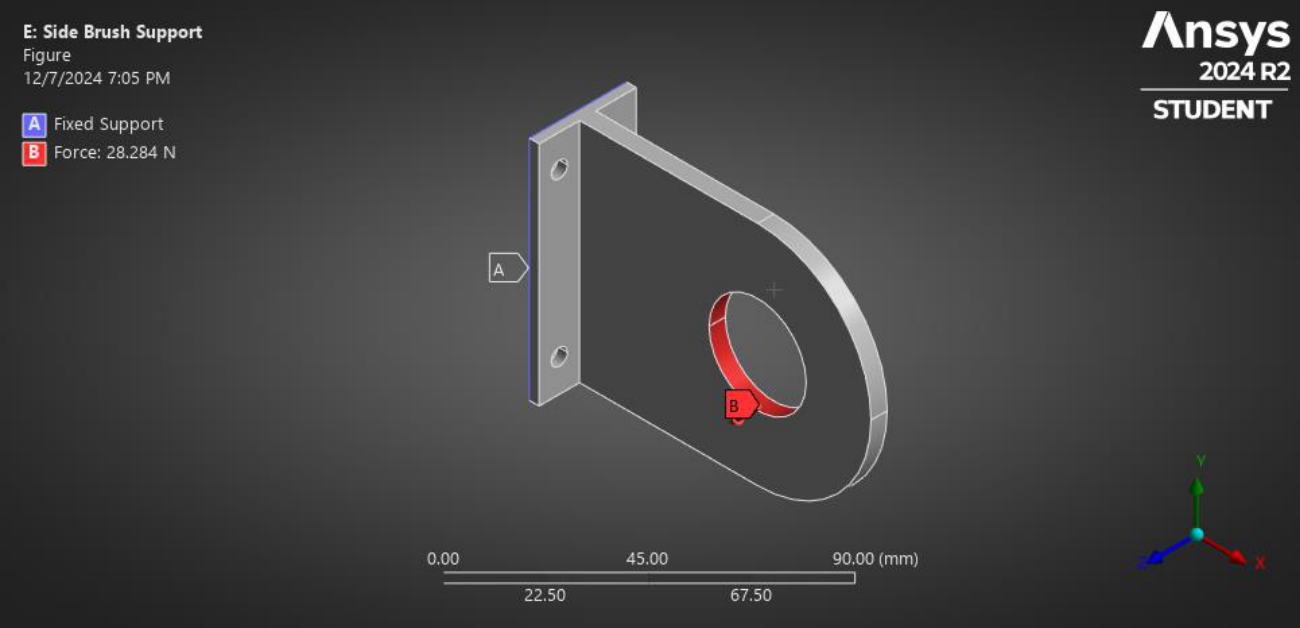
| Types | Force |
|---|---|
| X component | -20N |
| Y component | -20N |
| Z component | 0N |
5.3.5.1Total deformation
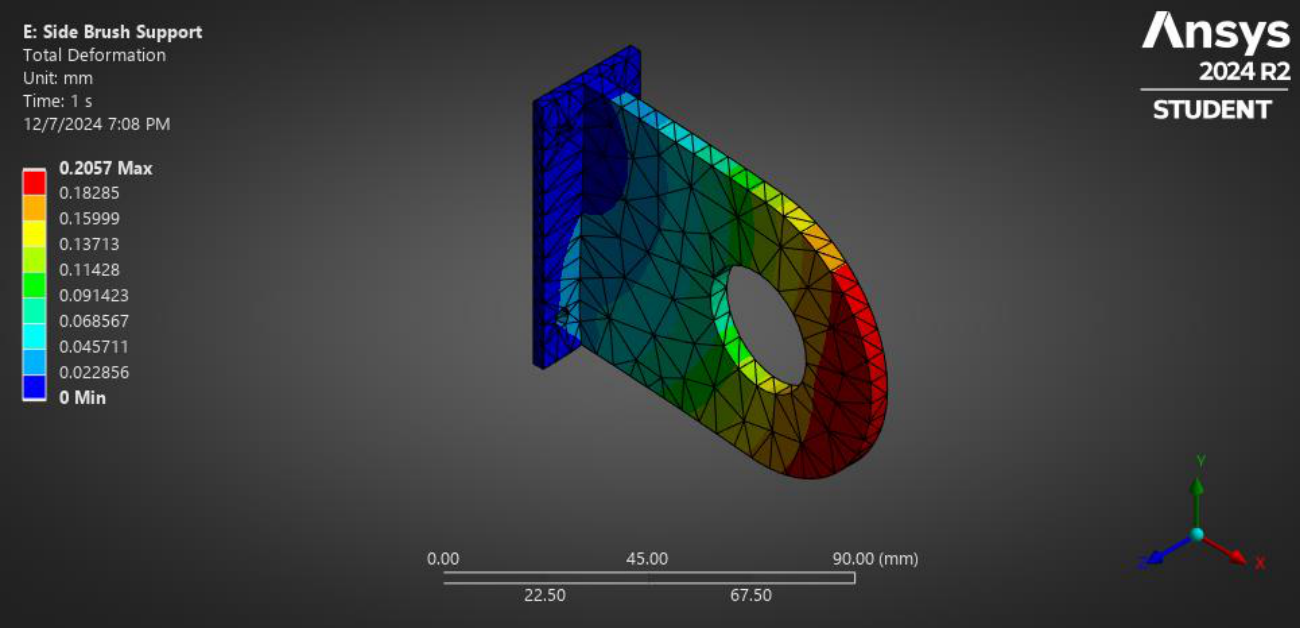
| Name of the Extremity | Total Deformation (mm) |
|---|---|
| Maximum | 0.2057 |
| Minimum | 0 |
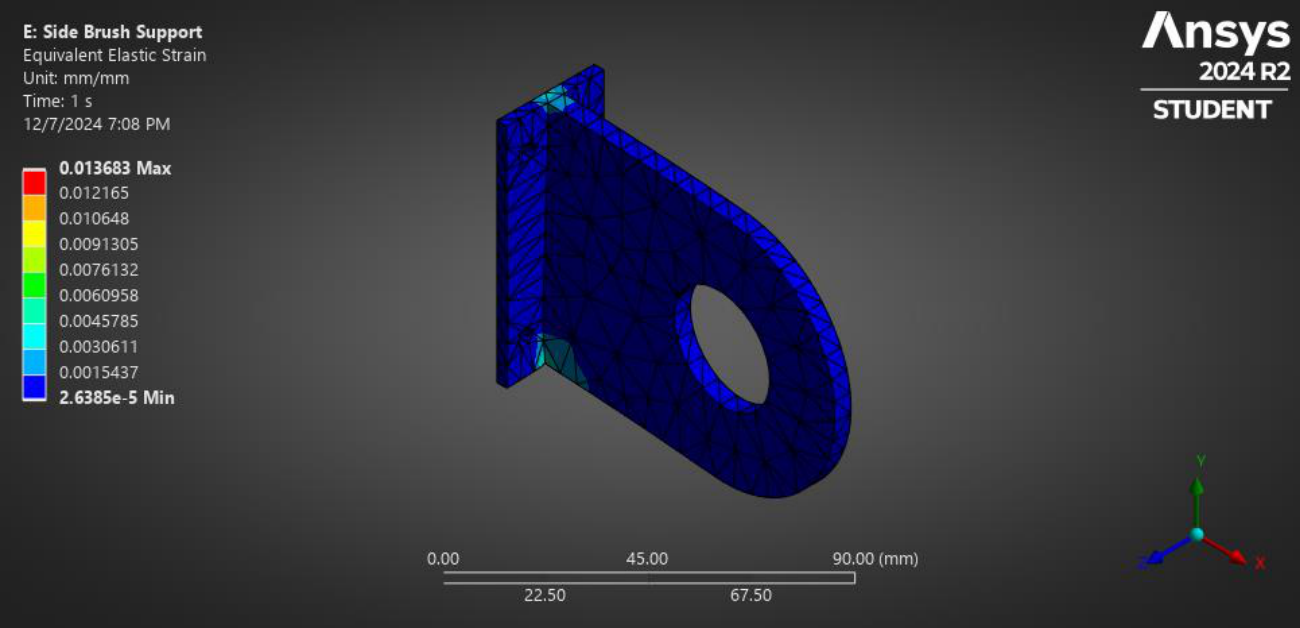
5.3.5.2Equivalent Strain
| Name of the Extremity | Equivalent Strain (mm/mm) |
|---|---|
| Maximum | 0.013683 |
| Minimum | 2.6385E-5 |
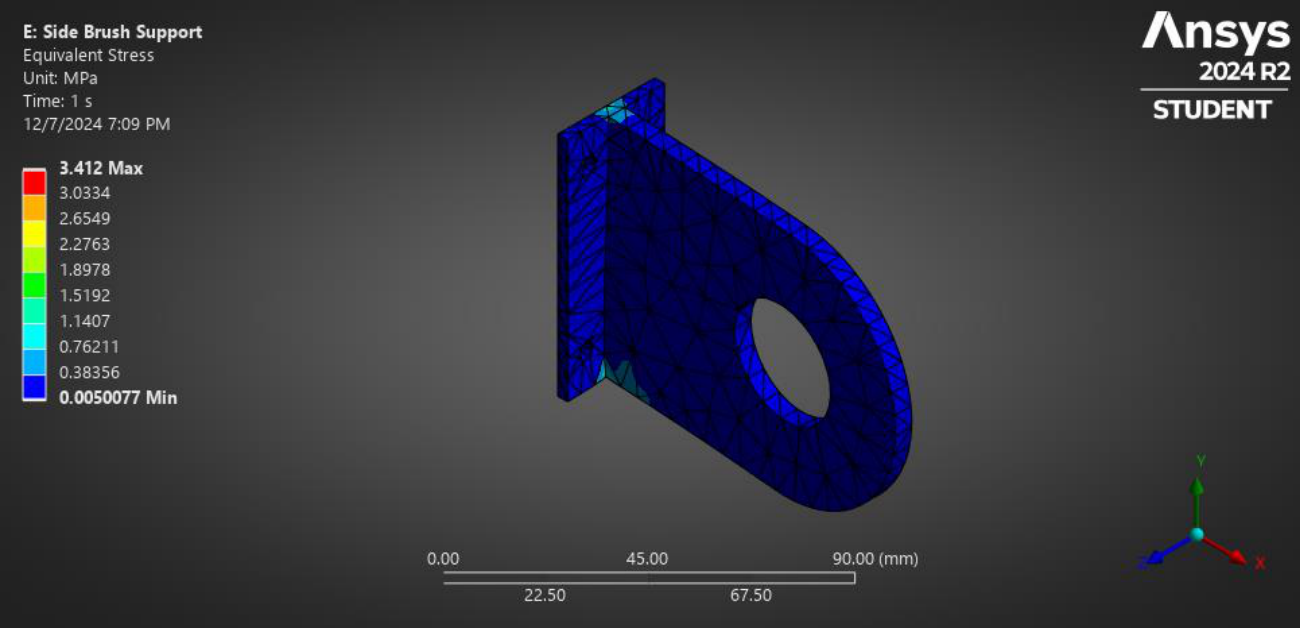
5.3.5.3Equivalent Elastic Stress (von Mises Stress)
| Name of the Extremity | Equivalent Stress (MPa) |
|---|---|
| Maximum | 3.412 |
| Minimum | 0.005077 |
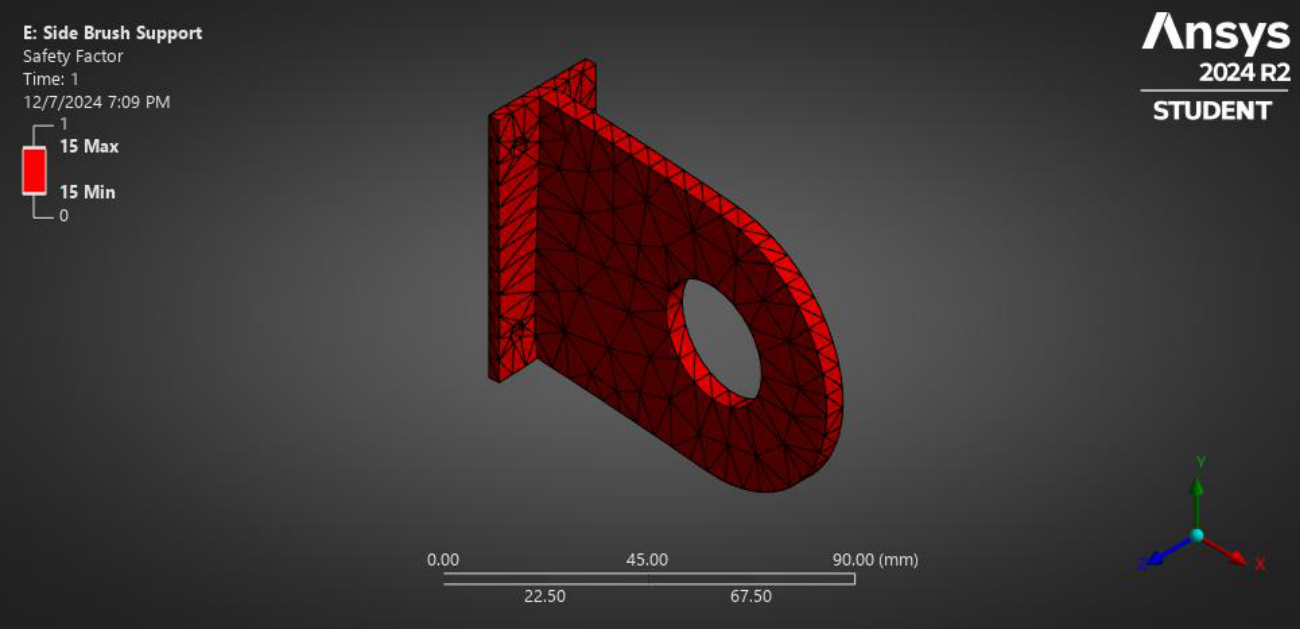
5.3.5.4Safety Factor
| Name of the Extremity | Safety Factor |
|---|---|
| Maximum | 15 |
| Minimum | 15 |
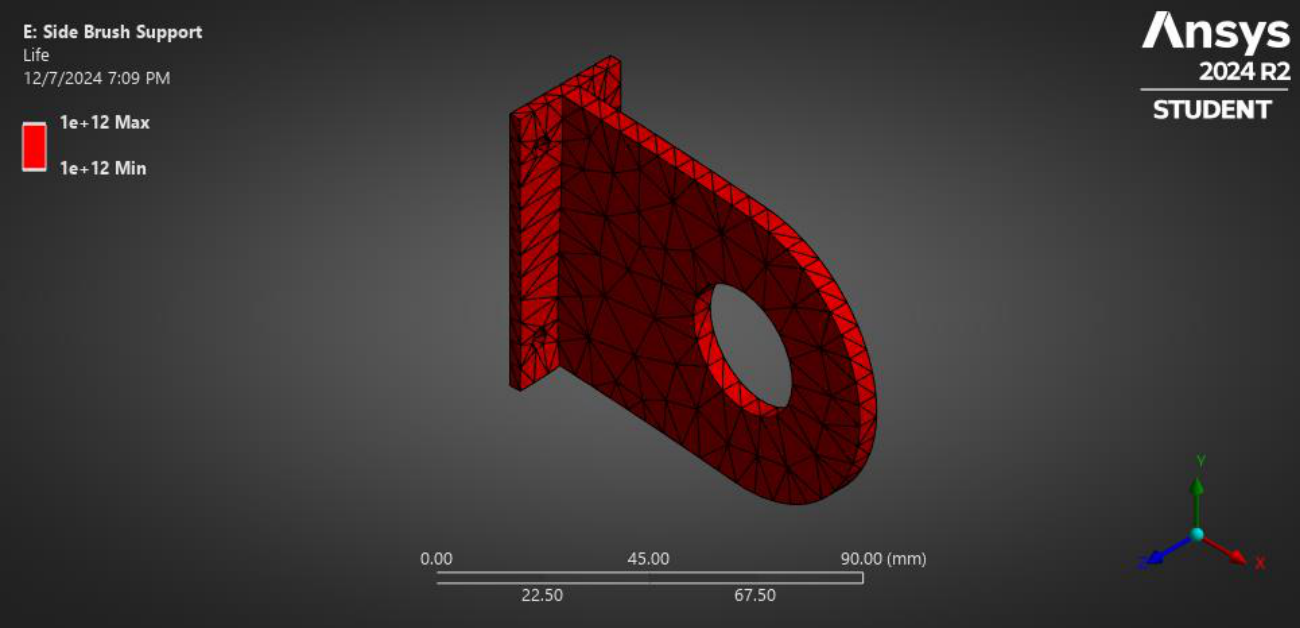
5.3.5.5Fatigue Life
| Name of the Extremity | Fatigue Life |
|---|---|
| Maximum | 1E+12 |
| Minimum | 1E+12 |
The ANSYS analysis showed insignificant deformation, thus supporting our choice of materials.
Qualitative Analysis of Material, Manufacturing Process, and Joining Process Selection
6.1Introduction
When developing a product, choosing the right material is one of the key decisions. This selection has a direct impact on performance, durability, appearance, cost, and environmental footprint. While quantitative methods focus on measurable traits like strength, density, and heat conductivity, qualitative approaches take a broader and more subjective view. They consider factors that are not easily measured but still play a crucial role in the product's overall success.
Qualitative analysis assesses the non-technical aspects of choosing materials. This includes factors like user experience, manufacturing limitations, sustainability, and aesthetic choices. Designers evaluate how the material fits the product's intended use. They also consider whether it matches the brand's identity. Additionally, the material's appeal to the end-users is considered.
6.2Qualitative Analysis of Material Selection for Different Sections
In product design, the selection of materials is one of the most critical decisions that will ultimately determine the product's performance, cost, and manufacturability. However, material selection cannot be approached uniformly across the entire product. Different sections or components of a product often have different requirements in terms of strength, durability, weight, thermal behavior, and environmental resistance.
The qualitative analysis of material selection for different sections of a product involves evaluating the specific demands of each part of the design, rather than choosing a single material for the entire product. This approach ensures that the materials selected optimize the performance of each section while considering factors such as design complexity, manufacturability, environmental impact, and cost-effectiveness.
| Section | Sub-section | Parts | Material Selection | Other Material Options | Reasons Behind Selection |
|---|---|---|---|---|---|
| Brush Cleaning Part | Base | Base | Nylon | Polycarbonate, ABS | Impact resistance, lightweight |
| Brush | Nylon Brush Fiber | Nylon 6 | Polypropylene, Polyester (PET) | Durability, flexibility, water resistance | |
| Motor | DC Motor | Gear Motor | Brushed DC Motor | High torque, speed regulation | |
| Mechanism | Worm Gear | Mild Steel | High-Speed Steel, Alloy Steel | Cost-effective, durability | |
| Shiner Part | Shiner Mechanism | Vibrating Plate | Stainless Steel | Mild Steel, Aluminum Alloy | Easy to clean, high durability |
| Shiner Mechanism | Mold Sponge | Polyurethane Foam | Rubber, Felt | Good cushioning, lightweight | |
| Shiner Mechanism | Dispenser | Mild Steel | Cast Iron, Mild | Lightweight, chemical resistance | |
| Shoe Sole Cleaning Part | Roller Mechanism | Roller Brush | Nylon Bristle | Polypropylene, PVC | Abrasion resistance, flexibility |
| Base | Base | Stainless Steel | High-Density Polyethylene | Durability, strength |
6.3Qualitative Analysis of Manufacturing Process Selection
The process of selecting materials must be closely aligned with the intended manufacturing process to optimize overall efficiency and quality. Each manufacturing process, whether it's injection molding, casting, forging, or additive manufacturing, has specific material requirements and constraints. These requirements include material form (e.g., solid, powder, sheet), thermal properties, machinability, and ease of processing, all of which influence the final design and production methods.
| Section | Sub-section | Parts | Possible Manufacturing Process | Make / Outsource | Process Selection | Reasons Behind Selection |
|---|---|---|---|---|---|---|
| Brush Cleaning Part | Base | Base | Injection Molding, Casting | Make | Injection Molding | Uniformity, cost-effective for complex shapes |
| Brush | Nylon Brush Fiber | Extrusion, Injection Molding | Outsource | Extrusion | Better control over fiber thickness | |
| Motor | DC Motor | Assembly | Outsource | Assembly | More convenient to buy pre-assembled | |
| Mechanism | Spur Gear | Gear Cutting, Hobbing | Make | Gear Cutting | Achieves high dimensional accuracy | |
| Shiner Part | Shiner Mechanism | Mold Sponge | Die Cutting | Make | Die Cutting | Cost-effective for soft materials |
| Motor | Motor | Assembly | Outsource | Assembly | More convenient to buy pre-assembled | |
| Shoe Sole Cleaning Part | Roller Mechanism | Roller Brush | Extrusion, Milling | Outsource | Extrusion | Cost-effective for brush production |
| Base | Base | Bending, Welding | Make | Bending | Durability, easy to form |
6.4Qualitative Analysis of Parts Joining Method Selection
In product design, selecting an appropriate part joining method is crucial for influencing both performance and manufacturability of the final product. The way in which components are joined—whether through welding, adhesive bonding, mechanical fastening, or another technique—affects not only the product's strength and durability but also its cost, assembly time, and overall functionality.
| Parts | Type of Joint | Joining Method Options | Joint Selected | Reasons Behind Selection |
|---|---|---|---|---|
| Base and Casing | Permanent | Brazing, Soldering, Explosion Welding, Friction Stir Welding | Brazing | Cheap, highly available |
| Base and Bearing | Permanent | Shrink Fitting, Press Fitting, Adhesive Bonding, Welding | Arc Welding | Cost-effective, no requirement of high precision |
| Motor and Shaft | Temporary | Threaded Connection, Welding, Tapered Connection with Locking Nut | Threaded Connection | Flexibility, easily removable |
| Bearing and Shaft | Temporary | Shrink Fitting, Press Fitting, Adhesive Bonding, Set Screw, Locking Collars | Press Fitting | Ease of maintenance, good for high-speed applications |
| Shaft and Gear | Permanent | Welding, Brazing, Adhesive Bonding, Tapered Shaft and Gear | Brazing | Cheap, highly available |
| Shaft and Wheel | Permanent | Bolted Joint, Adhesive Bonding, Keyed Joint, Welding | Brazing | Cost-effective, simple to execute |
| Wheel and Crank Shaft | Temporary | Bolted Flange Connection, Spline Connection, Welding | Bolted Flange Connection | High strength, ease of disassembly |
6.5Conclusion
In order to arrive at competent design decisions that balance performance, cost, and manufacturability, qualitative study of material selection, manufacturing procedures, and joining techniques is crucial. We can make sure that every part of the product is optimized for its particular function by assessing elements including functional needs, material compatibility, production capability, environmental impact, and design flexibility.
This rigorous process ensures the product satisfies technical requirements. It is also very environmentally friendly and efficient. It also continues to be affordable for the duration of its life. The design is better balanced when qualitative insights are included in the decision-making process. This reduces possible production and assembly risks while simultaneously increasing overall product quality and manufacturing convenience.
Quantitative Analysis of Material Selection with Weighted Average Method
7.1Introduction
The choice and application of materials have a significant impact on the price, performance, and quality while designing a product. We can cut waste, save money, and improve customer happiness by selecting the proper materials, methods and by using them efficiently.
Material selection procedure has a direct impact on the finished product's price, functionality, and sustainability. While developing or designing completely a new or modified product, an engineer has to be more considerate about the properties, aesthetics, functionality, and regulatory compliance. Besides, engineers and designers in the production team have to meet both customer requirements and technical requirements.
To assist decision makers in considering a variety of selection criteria and their interactions and in reaching the best conclusions, straightforward, methodical, and logical techniques or mathematical tools are required. Therefore, quantitative analysis for selection criteria is imperative to manufacture a good product.
There are several methods for quantifying the properties of a material or manufacturing process. Here, in this chapter, we are using the "Digital Logic Method" and "Weighted Average Method" for selecting material based on their performance indices.
Product design is steeped in research, strategy, and business. It considers the end users' needs and goals, as well as market trends and opportunities. It's not just about creating a better-looking product but also the perfect balance between form and function. In this chapter, we will discuss and analyze about:
- •Manufacturing process
- •Joining process
- •Finishing process
- •Coloring and aesthetics
Every component has unique properties, design, and requirements. All manufacturing processes are not optimized for AISI 440C Stainless Steel or 1060 mild steel. Different manufacturing processes have their own advantages, disadvantages, and cost effectiveness. The process which is suitable for metallic components won't be suitable for PVC-made components. So, by analyzing the selected process, we have to determine the most optimized process for manufacturing.
After manufacturing different components, we have to join them. Some components are joined permanently. In that case we will choose the best permanent joining process, and there are some movable components like the slider, for which we have to use a temporary joining process.
Surface finishes and coloring not only make products look presentable and unique, but they also play an important role in ensuring products perform as they are intended to perform and last longer. Finishes provide protection from outside elements, corrosion, wear, and rust. Surface finishes can be applied in a variety of ways: painting and rolling, spraying, electroplating, adhesives, sandblasting, etc.
In this analysis, we will use the weighted average method. Firstly, we will define the properties of process for certain materials, and then the digital logic method will be used for calculating performance index to find out proper processes.
7.2Structural Parts of Semi-automated Shoe Cleaner
Components List
1. Brush Cleaning Part
- Base
- Nylon Brush Fiber
- DC Motor
- Shaft
- Spur Gear
- Worm Gear
2. Shiner Part
- Mold Sponge
- Shiner
- Motor
3. Shoe Sole Cleaning Part
- Motor
- Roller and Brush
- Base
7.3Equations
7.4Likert Scale
Likert scale was introduced to survey research in 1930. Likert scale is a bipolar scale with interval levels that measure respondent attitudes and opinions. The Likert scale (typically) provides five possible answers to a statement or question that allows respondents to indicate their positive-to-negative strength of agreement or strength of feeling regarding the question or statement.
In this section, we will employ the Likert scale to assess criteria that lack numerical assignments. The scale is provided below:
| Qualitative Rating | Numerical Value |
|---|---|
| Very Good | 5 |
| Good | 4 |
| Moderate | 3 |
| Poor | 2 |
| Very Poor | 1 |
7.5Quantitative Analysis of Material Selection
7.5.1Material Selection for roller shaft
| Property | AISI 316 Stainless Steel | AISI 347 Annealed Stainless Steel | 1045 Carbon Steel (Cold Drawn) |
|---|---|---|---|
| Elastic Modulus (GPa) | 193 | 200 | 205 |
| Shear Modulus (GPa) | 77 | 78 | 80 |
| Mass Density (kg/m³) | 8000 | 8000 | 7850 |
| Coefficient of Thermal Expansion (/K) | 16.0 x 10⁻⁶ | 15.6 x 10⁻⁶ | 11.7 x 10⁻⁶ |
| Compressive Strength (MPa) | 1700 | 1724 | 310 |
| Approximate Cost (BDT/kg) | 500-600 | 600-700 | 150-250 |
| Property | AISI 316 Stainless Steel | AISI 347 Annealed Stainless Steel | 1045 Carbon Steel (Cold Drawn) |
|---|---|---|---|
| Weldability | 5 | 4 | 3 |
| Corrosion Resistance | 5 | 5 | 2 |
| Appearance | 5 | 5 | 2 |
| Availability | 5 | 4 | 5 |
| Selection Criteria | Number of Positive Decisions, $N = \frac{n(n-1)}{2} = \frac{10(10-1)}{2} = 45$ | Positive Decisions | Relative Emphasis ($\alpha$) | ||||||||||||||||||||||||||||||||||||||||||||
|---|---|---|---|---|---|---|---|---|---|---|---|---|---|---|---|---|---|---|---|---|---|---|---|---|---|---|---|---|---|---|---|---|---|---|---|---|---|---|---|---|---|---|---|---|---|---|---|
| 1 | 2 | 3 | 4 | 5 | 6 | 7 | 8 | 9 | 10 | 11 | 12 | 13 | 14 | 15 | 16 | 17 | 18 | 19 | 20 | 21 | 22 | 23 | 24 | 25 | 26 | 27 | 28 | 29 | 30 | 31 | 32 | 33 | 34 | 35 | 36 | 37 | 38 | 39 | 40 | 41 | 42 | 43 | 44 | 45 | |||
| Elastic Mod. | 1 | 1 | 1 | 1 | 1 | 1 | 1 | 1 | 1 | − | − | − | − | − | − | − | − | − | − | − | − | − | − | − | − | − | − | − | − | − | − | − | − | − | − | − | − | − | − | − | − | − | − | − | − | 9 | 0.2 |
| Shear Mod. | 0 | − | − | − | − | − | − | − | − | 1 | 1 | 1 | 1 | 1 | 1 | 1 | 1 | − | − | − | − | − | − | − | − | − | − | − | − | − | − | − | − | − | − | − | − | − | − | − | − | − | − | − | − | 8 | 0.178 |
| Mass Density | − | 0 | − | − | − | − | − | − | − | 0 | − | − | − | − | − | − | − | 1 | 1 | 1 | 1 | 1 | 1 | 1 | − | − | − | − | − | − | − | − | − | − | − | − | − | − | − | − | − | − | − | − | − | 7 | 0.156 |
| Coefficient of Ther. Ex. | − | − | 0 | − | − | − | − | − | − | − | 0 | − | − | − | − | − | − | 0 | − | − | − | − | − | − | 0 | 1 | 1 | 1 | 1 | 1 | − | − | − | − | − | − | − | − | − | − | − | − | − | − | − | 5 | 0.111 |
| Comp. Stren. | − | − | − | 0 | − | − | − | − | − | − | − | 0 | − | − | − | − | − | − | 0 | − | − | − | − | − | 1 | − | − | − | − | − | 1 | 1 | 1 | 1 | 1 | − | − | − | − | − | − | − | − | − | − | 6 | 0.133 |
| Cost | − | − | − | − | 0 | − | − | − | − | − | − | − | 0 | − | − | − | − | − | − | 0 | − | − | − | − | − | 0 | − | − | − | − | 0 | − | − | − | − | 0 | 0 | 1 | 1 | − | − | − | − | − | − | 2 | 0.044 |
| Weldability | − | − | − | − | − | 0 | − | − | − | − | − | − | − | 0 | − | − | − | − | − | − | 0 | − | − | − | − | − | 0 | − | − | − | − | 0 | − | − | − | 1 | − | − | − | 0 | 1 | 1 | − | − | − | 3 | 0.067 |
| Corr. Resistance | − | − | − | − | − | − | 0 | − | − | − | − | − | − | − | 0 | − | − | − | − | − | − | 0 | − | − | − | − | − | 0 | − | − | − | − | 0 | − | − | − | 1 | − | − | 1 | − | − | 1 | 1 | − | 4 | 0.089 |
| Appearance | − | − | − | − | − | − | − | 0 | − | − | − | − | − | − | − | 0 | − | − | − | − | − | − | 0 | − | − | − | − | − | 0 | − | − | − | − | 0 | − | − | − | 0 | − | − | 0 | − | 0 | − | 0 | 0 | 0 |
| Availability | − | − | − | − | − | − | − | − | 0 | − | − | − | − | − | − | − | 0 | − | − | − | − | − | − | 0 | − | − | − | − | − | 0 | − | − | − | − | 0 | − | − | − | 0 | − | − | 0 | − | 0 | 1 | 1 | 0.022 |
| Total Positive Decisions | 45 | 1 | |||||||||||||||||||||||||||||||||||||||||||||
| Selection Criteria | Weighting Factor ($\alpha$) | AISI 316 Stainless Steel | AISI 347 Annealed Stainless Steel | 1045 Carbon Steel | |||
|---|---|---|---|---|---|---|---|
| Scaled ($\beta$) | Score ($\alpha\beta$) | Scaled ($\beta$) | Score ($\alpha\beta$) | Scaled ($\beta$) | Score ($\alpha\beta$) | ||
| Elastic Modulus | 0.2 | 94.15 | 18.83 | 97.56 | 19.51 | 100 | 20 |
| Shear Modulus | 0.178 | 96.25 | 17.14 | 97.5 | 17.37 | 100 | 17.8 |
| Mass Density | 0.156 | 100 | 15.6 | 100 | 15.6 | 98.13 | 15.3 |
| Coefficient of Thermal Expansion | 0.111 | 73.13 | 8.12 | 75 | 8.33 | 100 | 11.1 |
| Compressive Strength | 0.133 | 98.61 | 13.12 | 100 | 13.3 | 17.99 | 2.39 |
| Cost | 0.044 | 30 | 1.32 | 25 | 1.1 | 100 | 4.4 |
| Weldability | 0.067 | 5 | 0.335 | 4 | 0.268 | 3 | 0.201 |
| Corrosion Resistance | 0.089 | 5 | 0.445 | 5 | 0.445 | 2 | 0.178 |
| Appearance | 0 | 5 | 0 | 5 | 0 | 2 | 0 |
| Availability | 0.022 | 5 | 0.11 | 4 | 0.088 | 5 | 0.11 |
| Performance Index ($\gamma = \sum \alpha\beta$) | 75.02 | 76.011 | 71.479 | ||||
7.5.2Material Selection for frame and base
| Property | Aluminum Alloy (6061) | Stainless Steel (AISI 304) | High-Density Polyethylene (HDPE) | Mild Steel |
|---|---|---|---|---|
| Density (kg/m³) | 2700 | 8000 | 950 | 7850 |
| Tensile Strength (MPa) | 290 | 520 | 26 | 370 |
| Elastic Modulus (GPa) | 69 | 193 | 0.8 | 210 |
| Property | Aluminum Alloy (6061) | Stainless Steel (AISI 304) | High-Density Polyethylene (HDPE) | Mild Steel |
|---|---|---|---|---|
| Cost | 3 | 1 | 5 | 5 |
| Appearance | 4 | 5 | 3 | 2 |
Explanation of Likert Ratings:
- 5: Bright, polished
- 4: Smooth, metallic, matte or polished
- 3: Opaque, smooth, matte
- 2: Dull gray, can be painted or coated
- 5: Low (Most affordable)
- 3: Moderate
- 1: High (Most expensive)
| Selection Criteria | Number of Positive Decisions, $N = \frac{n(n-1)}{2} = \frac{5(5-1)}{2} = 10$ | Positive Decisions | Relative Emphasis ($\alpha$) | |||||||||
|---|---|---|---|---|---|---|---|---|---|---|---|---|
| 1 | 2 | 3 | 4 | 5 | 6 | 7 | 8 | 9 | 10 | |||
| Density (kg/m³) | 0 | 0 | 1 | 1 | − | − | − | − | − | − | 2 | 0.2 |
| Tensile Strength (MPa) | 1 | − | − | − | 1 | 0 | 1 | − | − | − | 3 | 0.3 |
| Elastic Modulus (GPa) | − | 1 | − | − | 0 | − | − | 1 | 0 | − | 2 | 0.2 |
| Cost | − | − | 0 | − | − | 1 | − | 0 | − | 1 | 2 | 0.2 |
| Appearance | − | − | − | 0 | − | − | 0 | − | 1 | 0 | 1 | 0.1 |
| Total Positive Decisions | 10 | 1 | ||||||||||
| Selection Criteria | Weighting Factor ($\alpha$) | Aluminum Alloy (6061) | Stainless Steel (AISI 304) | HDPE | Mild Steel | ||||
|---|---|---|---|---|---|---|---|---|---|
| Scaled ($\beta$) | Score ($\alpha\beta$) | Scaled ($\beta$) | Score ($\alpha\beta$) | Scaled ($\beta$) | Score ($\alpha\beta$) | Scaled ($\beta$) | Score ($\alpha\beta$) | ||
| Density | 0.2 | 35.19 | 7.04 | 11.88 | 2.38 | 100 | 20 | 12.1 | 2.42 |
| Tensile Strength | 0.3 | 55.77 | 16.73 | 100 | 30 | 5 | 1.5 | 71.15 | 21.35 |
| Elastic Modulus | 0.2 | 32.86 | 6.57 | 91.9 | 18.38 | 0.38 | 0.08 | 100 | 20 |
| Cost | 0.2 | 33.33 | 6.67 | 100 | 20 | 20 | 4 | 20 | 4 |
| Appearance | 0.1 | 4 | 0.4 | 5 | 0.5 | 3 | 0.3 | 2 | 0.2 |
| Performance Index ($\gamma = \sum \alpha\beta$) | 37.41 | 71.26 | 25.88 | 47.97 | |||||
7.5.3Material Selection for lower sole cleaner brush fiber
| Property | Nylon 6 | Polypropylene | Polyester (PET) |
|---|---|---|---|
| Abrasion Resistance | 5 | 3 | 4 |
| Flexibility | 4 | 5 | 3 |
| Water Resistance | 5 | 5 | 4 |
| Durability | 5 | 3 | 3 |
| Cost (BDT per kg) | 250 | 150 | 200 |
| Selection Criteria | Number of Positive Decisions, $N = \frac{n(n-1)}{2} = \frac{5(5-1)}{2} = 10$ | Positive Decisions | Relative Emphasis ($\alpha$) | |||||||||
|---|---|---|---|---|---|---|---|---|---|---|---|---|
| 1 | 2 | 3 | 4 | 5 | 6 | 7 | 8 | 9 | 10 | |||
| Abrasion Resistance | 1 | 1 | 1 | 1 | − | − | − | − | − | − | 4 | 0.4 |
| Flexibility | 0 | − | − | − | 0 | 1 | 1 | − | − | − | 2 | 0.2 |
| Water Resistance | − | 0 | − | − | 1 | − | − | 1 | 1 | − | 3 | 0.3 |
| Durability | − | − | 0 | − | − | 0 | − | 0 | − | 1 | 1 | 0.1 |
| Cost | − | − | − | 0 | − | − | 0 | − | 0 | 0 | 0 | 0 |
| Total Positive Decisions | 10 | 1 | ||||||||||
| Selection Criteria | Weighting Factor ($\alpha$) | Nylon 6 | Polypropylene (β) | Polyester (PET) | |||
|---|---|---|---|---|---|---|---|
| Scaled ($\beta$) | Score ($\alpha\beta$) | Scaled ($\beta$) | Score ($\alpha\beta$) | Scaled ($\beta$) | Score ($\alpha\beta$) | ||
| Abrasion Resistance | 0.4 | 100 | 40 | 60 | 24 | 80 | 32 |
| Flexibility | 0.2 | 80 | 16 | 100 | 20 | 60 | 12 |
| Water Resistance | 0.3 | 100 | 30 | 100 | 30 | 80 | 24 |
| Durability | 0.1 | 100 | 10 | 60 | 6 | 60 | 6 |
| Cost | 0 | 60 | 0 | 100 | 0 | 75 | 0 |
| Performance Index ($\gamma = \sum \alpha\beta$) | 96 | 80 | 74 | ||||
At the first stage of our designing process, we had selected the most suitable materials under consideration based on different criteria of components. After extensive numerical analysis, we selected certain materials from different alternatives for different parts by analyzing in the digital logic method and performance index. As we have selected our desired materials, now we can move to the process and manufacturing selection section.
7.6Quantitative Analysis of Manufacturing Processes
7.6.1Manufacturing processes for manufacturing AISI 347 Annealed Stainless Steel for roller shaft
| Criteria | Turning on Lathe Machine | Extrusion | CNC Machining |
|---|---|---|---|
| Dimensional Accuracy | 4 | 2 | 5 |
| Surface Finish | 4 | 3 | 5 |
| Metallurgical Properties | 5 | 4 | 5 |
| Cost Efficiency | 3 | 5 | 2 |
| Machining Time | 4 | 5 | 3 |
| Process Complexity | 3 | 2 | 4 |
| Selection Criteria | Number of Positive Decisions, $N = \frac{n(n-1)}{2} = \frac{6(6-1)}{2} = 15$ | Positive Decisions | Relative Emphasis ($\alpha$) | ||||||||||||||
|---|---|---|---|---|---|---|---|---|---|---|---|---|---|---|---|---|---|
| 1 | 2 | 3 | 4 | 5 | 6 | 7 | 8 | 9 | 10 | 11 | 12 | 13 | 14 | 15 | |||
| Dimensional Accuracy | 1 | 1 | 1 | 1 | 1 | − | − | − | − | − | − | − | − | − | − | 5 | 0.333 |
| Surface Finish | 0 | − | − | − | − | 1 | 1 | 1 | 1 | − | − | − | − | − | − | 4 | 0.267 |
| Metallurgical Properties | − | 0 | − | − | − | 0 | − | − | − | 1 | 1 | 1 | − | − | − | 3 | 0.200 |
| Cost Efficiency | − | − | 0 | − | − | − | 0 | − | − | 0 | − | − | 1 | 1 | − | 2 | 0.133 |
| Machining Time | − | − | − | 0 | − | − | − | 0 | − | − | 0 | − | 0 | − | 1 | 1 | 0.067 |
| Process Complexity | − | − | − | − | 0 | − | − | − | 0 | − | − | 0 | − | 0 | 0 | 0 | 0.000 |
| Total Positive Decisions | 15 | 1.000 | |||||||||||||||
| Selection Criteria | Weighting Factor ($\alpha$) | Turning on Lathe Machine | Extrusion | CNC Machining | |||
|---|---|---|---|---|---|---|---|
| Scaled ($\beta$) | Score ($\alpha\beta$) | Scaled ($\beta$) | Score ($\alpha\beta$) | Scaled ($\beta$) | Score ($\alpha\beta$) | ||
| Dimension al Accuracy | 0.333 | 80 | 26.64 | 40 | 13.32 | 100 | 33.3 |
| Surface Finish | 0.267 | 80 | 21.36 | 60 | 16.02 | 100 | 26.7 |
| Metallurgic al Properties | 0.2 | 100 | 20 | 80 | 16 | 100 | 20 |
| Cost Efficiency | 0.133 | 60 | 7.98 | 100 | 13.3 | 40 | 5.32 |
| Machining Time | 0.067 | 80 | 5.36 | 100 | 6.7 | 60 | 4.02 |
| Process Complexit y | 0 | 75 | 0 | 50 | 0 | 100 | 0 |
| Performance Index ($\gamma = \sum \alpha\beta$) | 81.34 | 65.34 | 89.34 | ||||
7.6.2Manufacturing process for Stainless Steel (AISI 304) for base and frame
| Criteria | Laser Cutting | Welding and Assembly | Sheet Metal Forming |
|---|---|---|---|
| Dimensional Accuracy | 5 | 4 | 3 |
| Surface Finish | 4 | 3 | 3 |
| Structural Strength | 3 | 5 | 4 |
| Cost Efficiency | 3 | 4 | 5 |
| Machining Time | 4 | 3 | 4 |
| Process Complexity | 3 | 2 | 4 |
| Selection Criteria | Number of Positive Decisions, $N = \frac{n(n-1)}{2} = \frac{6(6-1)}{2} = 15$ | Positive Decisions | Relative Emphasis ($\alpha$) | ||||||||||||||
|---|---|---|---|---|---|---|---|---|---|---|---|---|---|---|---|---|---|
| 1 | 2 | 3 | 4 | 5 | 6 | 7 | 8 | 9 | 10 | 11 | 12 | 13 | 14 | 15 | |||
| Dimensional Accuracy | 1 | 0 | 1 | 1 | 1 | − | − | − | − | − | − | − | − | − | − | 4 | 0.267 |
| Surface Finish | 0 | − | − | − | − | 0 | 1 | 1 | 1 | − | − | − | − | − | − | 3 | 0.200 |
| Structural Strength | − | 1 | − | − | − | 1 | − | − | − | 1 | 1 | 1 | − | − | − | 5 | 0.333 |
| Cost Efficiency | − | − | 0 | − | − | − | 0 | − | − | 0 | − | − | 1 | 1 | − | 2 | 0.133 |
| Machining Time | − | − | − | 0 | − | − | − | 0 | − | − | 0 | − | 0 | − | 1 | 1 | 0.067 |
| Process Complexity | − | − | − | − | 0 | − | − | − | 0 | − | − | 0 | − | 0 | 0 | 0 | 0.000 |
| Total Positive Decisions | 15 | 1 | |||||||||||||||
| Selection Criteria | Weighting Factor ($\alpha$) | Laser Cutting | Welding and Assembly | Sheet Metal Forming | |||
|---|---|---|---|---|---|---|---|
| Scaled ($\beta$) | Score ($\alpha\beta$) | Scaled ($\beta$) | Score ($\alpha\beta$) | Scaled ($\beta$) | Score ($\alpha\beta$) | ||
| Dimensional Accuracy | 0.267 | 100 | 26.7 | 80 | 21.36 | 60 | 16.02 |
| Surface Finish | 0.2 | 100 | 20 | 75 | 15 | 75 | 15 |
| Structural Strength | 0.333 | 60 | 19.98 | 100 | 33.3 | 80 | 26.64 |
| Cost Efficiency | 0.133 | 60 | 7.98 | 80 | 10.64 | 100 | 13.3 |
| Machining Time | 0.067 | 100 | 6.7 | 75 | 5.03 | 100 | 6.7 |
| Process Complexity | 0 | 75 | 0 | 50 | 0 | 100 | 0 |
| Performance Index ($\gamma = \sum \alpha\beta$) | 81.36 | 85.33 | 77.66 | ||||
7.6.3Manufacturing process for Nylon 6 lower sole cleaner brush fiber
For Nylon 6 brush fibers, we'll consider the following manufacturing processes:
- •Injection Molding
- •Extrusion
- •Monofilament Drawing
| Criteria | Injection Molding | Extrusion | Monofilament Drawing |
|---|---|---|---|
| Abrasion Resistance | 4 | 5 | 4 |
| Flexibility | 3 | 4 | 5 |
| Durability | 4 | 4 | 5 |
| Cost Efficiency | 3 | 4 | 3 |
| Ease of Manufacturing | 4 | 5 | 3 |
| Selection Criteria | Number of Positive Decisions, $N = \frac{n(n-1)}{2} = \frac{5(5-1)}{2} = 10$ | Positive Decisions | Relative Emphasis ($\alpha$) | |||||||||
|---|---|---|---|---|---|---|---|---|---|---|---|---|
| 1 | 2 | 3 | 4 | 5 | 6 | 7 | 8 | 9 | 10 | |||
| Abrasion Resistance | 1 | 1 | 1 | 1 | − | − | − | − | − | − | 4 | 0.4 |
| Flexibility | 0 | − | − | − | 1 | 1 | 1 | − | − | − | 3 | 0.3 |
| Durability | − | 0 | − | − | 0 | − | − | 1 | 1 | − | 2 | 0.2 |
| Cost Efficiency | − | − | 0 | − | − | 0 | − | 0 | − | 1 | 1 | 0.1 |
| Ease of Manufacturing | − | − | − | 0 | − | − | 0 | − | 0 | 0 | 0 | 0 |
| Total Positive Decisions | 10 | 1 | ||||||||||
| Selection Criteria | Weighting Factor ($\alpha$) | Injection Molding | Extrusion | Monofilament Drawing | |||
|---|---|---|---|---|---|---|---|
| Scaled ($\beta$) | Score ($\alpha\beta$) | Scaled ($\beta$) | Score ($\alpha\beta$) | Scaled ($\beta$) | Score ($\alpha\beta$) | ||
| Abrasion Resistance | 0.4 | 80 | 32 | 100 | 40 | 80 | 32 |
| Flexibility | 0.3 | 60 | 18 | 80 | 24 | 100 | 30 |
| Durability | 0.2 | 80 | 16 | 80 | 16 | 100 | 20 |
| Cost Efficiency | 0.1 | 75 | 7.5 | 100 | 10 | 75 | 7.5 |
| Ease of Manufac. | 0 | 80 | 0 | 100 | 0 | 60 | 0 |
| Performance Index ($\gamma = \sum \alpha\beta$) | 73.5 | 90 | 89.5 | ||||
7.7Joining Process
Fabrication or joining processes are part and parcel in manufacturing where two or more solid elements are joined temporarily or permanently to form a single component. Initially engineering joining methods can be broadly classified into two main groups:
- •Permanent: Welding, brazing, soldering.
- •Non-permanent (Temporary): Adhesive bonding, crimping, shrink fitting, bolting or screwing (mechanical joining), clamping, fasteners like clutch, nut-bolt, nail hook, etc.
7.7.1Permanent Joining Process for semi-automated shoe cleaner
| Criteria | TIG Welding | MIG Welding | Spot Welding | Arc Welding |
|---|---|---|---|---|
| Strength of Joint | 5 | 4 | 3 | 4 |
| Precision | 5 | 4 | 2 | 3 |
| Durability | 5 | 4 | 3 | 4 |
| Cost Efficiency | 2 | 4 | 5 | 4 |
| Ease of Operation | 3 | 5 | 5 | 3 |
| Selection Criteria | Number of Positive Decisions, $N = \frac{n(n-1)}{2} = \frac{5(5-1)}{2} = 10$ | Positive Decisions | Relative Emphasis ($\alpha$) | |||||||||
|---|---|---|---|---|---|---|---|---|---|---|---|---|
| 1 | 2 | 3 | 4 | 5 | 6 | 7 | 8 | 9 | 10 | |||
| Strength of Joint | 1 | 1 | 1 | 1 | − | − | − | − | − | − | 4 | 0.4 |
| Precision | 0 | − | − | − | 1 | 1 | 1 | − | − | − | 3 | 0.3 |
| Durability | − | 0 | − | − | 0 | − | − | 1 | 1 | − | 2 | 0.2 |
| Cost Efficiency | − | − | 0 | − | − | 0 | − | 0 | − | 1 | 1 | 0.1 |
| Ease of Operation | − | − | − | 0 | − | − | 0 | − | 0 | 0 | 0 | 0 |
| Total Positive Decisions | 10 | 1 | ||||||||||
| Selection Criteria | Weighting Factor ($\alpha$) | TIG Welding | MIG Welding | Spot Welding | Arc Welding | ||||
|---|---|---|---|---|---|---|---|---|---|
| Scaled ($\beta$) | Score ($\alpha\beta$) | Scaled ($\beta$) | Score ($\alpha\beta$) | Scaled ($\beta$) | Score ($\alpha\beta$) | Scaled ($\beta$) | Score ($\alpha\beta$) | ||
| Strength of Joint | 0.4 | 100 | 40 | 80 | 32 | 60 | 24 | 80 | 32 |
| Precision | 0.3 | 100 | 30 | 80 | 24 | 40 | 12 | 60 | 18 |
| Durability | 0.2 | 100 | 20 | 80 | 16 | 60 | 12 | 80 | 16 |
| Cost Efficiency | 0.1 | 40 | 4 | 80 | 8 | 100 | 10 | 80 | 8 |
| Ease of Operation | 0 | 60 | 0 | 100 | 0 | 100 | 0 | 60 | 0 |
| Performance Index ($\gamma = \sum \alpha\beta$) | 94 | 80 | 58 | 74 | |||||
7.7.2Temporary Joining Process for semi-automated shoe cleaner
| Criteria | Bolts and Nuts | Threaded Inserts | Clamping | Snap Fit |
|---|---|---|---|---|
| Ease of Assembly/Disassembly | 4 | 3 | 5 | 5 |
| Holding Strength | 5 | 4 | 3 | 3 |
| Cost Efficiency | 4 | 3 | 5 | 4 |
| Durability of Joint | 5 | 4 | 3 | 3 |
| Vibration Resistance | 4 | 4 | 2 | 3 |
| Selection Criteria | Number of Positive Decisions, $N = \frac{n(n-1)}{2} = \frac{5(5-1)}{2} = 10$ | Positive Decisions | Relative Emphasis ($\alpha$) | |||||||||
|---|---|---|---|---|---|---|---|---|---|---|---|---|
| 1 | 2 | 3 | 4 | 5 | 6 | 7 | 8 | 9 | 10 | |||
| Ease of Assembly/Disassembly | 1 | 1 | 1 | 1 | − | − | − | − | − | − | 4 | 0.4 |
| Holding Strength | 0 | − | − | − | 1 | 1 | 1 | − | − | − | 3 | 0.3 |
| Cost Efficiency | − | 0 | − | − | 0 | − | − | 1 | 1 | − | 2 | 0.2 |
| Durability of Joint | − | − | 0 | − | − | 0 | − | 0 | − | 1 | 1 | 0.1 |
| Vibration Resistance | − | − | − | 0 | − | − | 0 | − | 0 | 0 | 0 | 0 |
| Total Positive Decisions | 10 | 1 | ||||||||||
| Selection Criteria | Weighting Factor ($\alpha$) | Bolts and Nuts | Threaded Inserts | Clamping | Snap Fit | ||||
|---|---|---|---|---|---|---|---|---|---|
| Scaled ($\beta$) | Score ($\alpha\beta$) | Scaled ($\beta$) | Score ($\alpha\beta$) | Scaled ($\beta$) | Score ($\alpha\beta$) | Scaled ($\beta$) | Score ($\alpha\beta$) | ||
| Ease of Assembly/Disassembly | 0.4 | 80 | 32 | 60 | 24 | 100 | 40 | 100 | 40 |
| Holding Strength | 0.3 | 100 | 30 | 80 | 24 | 60 | 18 | 60 | 18 |
| Cost Efficiency | 0.2 | 80 | 16 | 60 | 12 | 100 | 20 | 80 | 16 |
| Durability of Joint | 0.1 | 100 | 10 | 80 | 8 | 60 | 6 | 60 | 6 |
| Vibration Resistance | 0 | 80 | 0 | 80 | 0 | 40 | 0 | 60 | 0 |
| Performance Index ($\gamma = \sum \alpha\beta$) | 88 | 68 | 84 | 80 | |||||
7.8Finishing Operations of Parts
| Criteria | Polishing | Electroplating | Powder Coating |
|---|---|---|---|
| Surface Smoothness | 5 | 4 | 3 |
| Corrosion Resistance | 2 | 5 | 4 |
| Aesthetic Appeal | 4 | 4 | 5 |
| Cost Efficiency | 3 | 3 | 4 |
| Durability of Finish | 2 | 4 | 5 |
| Selection Criteria | Number of Positive Decisions, $N = \frac{n(n-1)}{2} = \frac{5(5-1)}{2} = 10$ | Positive Decisions | Relative Emphasis ($\alpha$) | |||||||||
|---|---|---|---|---|---|---|---|---|---|---|---|---|
| 1 | 2 | 3 | 4 | 5 | 6 | 7 | 8 | 9 | 10 | |||
| Surface Smoothness | 1 | 1 | 1 | 1 | − | − | − | − | − | − | 4 | 0.4 |
| Corrosion Resistance | 0 | − | − | − | 1 | 1 | 1 | − | − | − | 3 | 0.3 |
| Aesthetic Appeal | − | 0 | − | − | 0 | − | − | 1 | 1 | − | 2 | 0.2 |
| Cost Efficiency | − | − | 0 | − | − | 0 | − | 0 | − | 1 | 1 | 0.1 |
| Durability of Finish | − | − | − | 0 | − | − | 0 | − | 0 | 0 | 0 | 0 |
| Total Positive Decisions | 10 | 1 | ||||||||||
| Selection Criteria | Weighting Factor ($\alpha$) | Polishing | Electroplating | Powder Coating | |||
|---|---|---|---|---|---|---|---|
| Scaled ($\beta$) | Score ($\alpha\beta$) | Scaled ($\beta$) | Score ($\alpha\beta$) | Scaled ($\beta$) | Score ($\alpha\beta$) | ||
| Surface Smoothness | 0.4 | 100 | 40 | 80 | 32 | 60 | 24 |
| Corrosion Resistance | 0.3 | 40 | 12 | 100 | 30 | 80 | 24 |
| Aesthetic Appeal | 0.2 | 80 | 16 | 80 | 16 | 100 | 20 |
| Cost Efficiency | 0.1 | 75 | 7.5 | 75 | 7.5 | 100 | 10 |
| Durability of Finish | 0 | 40 | 0 | 80 | 0 | 100 | 0 |
| Performance Index ($\gamma = \sum \alpha\beta$) | 75.5 | 85.5 | 78 | ||||
7.9Criteria for Coloring and Aesthetic Finish
| Criteria | Powder Coating | Anodizing | Spray Painting |
|---|---|---|---|
| Aesthetic Appeal | 4 | 4 | 5 |
| Durability of Finish | 5 | 4 | 3 |
| Cost Efficiency | 4 | 3 | 5 |
| Corrosion Resistance | 5 | 4 | 3 |
| Ease of Application | 4 | 3 | 5 |
| Selection Criteria | Number of Positive Decisions, $N = \frac{n(n-1)}{2} = \frac{5(5-1)}{2} = 10$ | Positive Decisions | Relative Emphasis ($\alpha$) | |||||||||
|---|---|---|---|---|---|---|---|---|---|---|---|---|
| 1 | 2 | 3 | 4 | 5 | 6 | 7 | 8 | 9 | 10 | |||
| Aesthetic Appeal | 1 | 1 | 1 | 1 | − | − | − | − | − | − | 4 | 0.4 |
| Durability of Finish | 0 | − | − | − | 1 | 1 | 1 | − | − | − | 3 | 0.3 |
| Cost Efficiency | − | 0 | − | − | 0 | − | − | 1 | 1 | − | 2 | 0.2 |
| Corrosion Resistance | − | − | 0 | − | − | 0 | − | 0 | − | 1 | 1 | 0.1 |
| Ease of Application | − | − | − | 0 | − | − | 0 | − | 0 | 0 | 0 | 0 |
| Total Positive Decisions | 10 | 1 | ||||||||||
| Selection Criteria | Weighting Factor ($\alpha$) | Powder Coating | Anodizing | Spray Painting | |||
|---|---|---|---|---|---|---|---|
| Scaled ($\beta$) | Score ($\alpha\beta$) | Scaled ($\beta$) | Score ($\alpha\beta$) | Scaled ($\beta$) | Score ($\alpha\beta$) | ||
| Aesthetic Appeal | 0.4 | 80 | 32 | 80 | 32 | 100 | 40 |
| Durability of Finish | 0.3 | 100 | 30 | 80 | 24 | 60 | 18 |
| Cost Efficiency | 0.2 | 80 | 16 | 60 | 12 | 100 | 20 |
| Corrosion Resistance | 0.1 | 100 | 10 | 80 | 8 | 60 | 6 |
| Ease of Application | 0 | 80 | 0 | 60 | 0 | 100 | 0 |
| Performance Index ($\gamma = \sum \alpha\beta$) | 88 | 76 | 84 | ||||
7.10Conclusion
Based on the above numerical analysis, we conclude that different processes have distinctive advantages and disadvantages. The same manufacturing process is not applicable to all types of parts or materials.
In this chapter, we have determined the optimized processes for manufacturing, joining, finishing, and coloring operations.
Cost & Sensitivity Analysis
8.1Introduction
Cost is deeply intertwined with product design, as design decisions significantly impact overall expenses. The primary factors shaping a product's economic viability are cost and revenue, with the aim of minimizing costs while maximizing profits. Conducting a cost analysis highlights a product's capacity to generate the desired output while remaining profitable. It also helps evaluate whether the product can reach its break-even point effectively.
8.2Forecasting Demand
Methodology: Proportional Scaling Approach. We utilized the Proportional Scaling Approach to forecast the one-year demand for the proposed product. This method is based on survey results and assumes that the sample accurately represents the target population. The steps of the methodology are outlined below:
8.2.1Target Population Identification
The total number of potential adopters for the product was identified as 2,941 institutions in the target urban zone, comprising 245 Hotels, 324 Schools and Colleges, 136 Hospitals, 115 Private Universities, 1,200 Private Bank Branches, and 921 Corporate Commercial Offices.
8.2.2Survey Implementation
A survey was conducted among 35 individuals from corresponding institutions, which served as a representative sample of the target population. The survey revealed that 80% of the respondents (28 out of 35) expressed definitive interest in adopting the product.
8.2.3Adoption Rate Calculation
The adoption rate was calculated using the following formulation:
8.2.4Demand Forecasting
The adoption rate was scaled up to the entire target population to estimate the total demand. The formula used was:
Hence, the estimated one-year gross demand for the product is 2,353 units.
8.2.5Scenario Analysis
To address potential variations in market conditions, sensitivity analysis was performed using different adoption scenarios:
In conclusion, the Proportional Scaling Approach offers a straightforward and effective means of forecasting demand using survey data. The projected realistic demand for the product in its first year is 1,882 units.
8.3Manufacturing Cost
Manufacturing cost is the cost of production directly incurred during the manufacturing process. It comprises direct labor, direct material, and manufacturing overhead costs. With a projected realistic annual demand of 1,882 units, our production strategy targets capturing approximately 30% market share during Year 1, establishing an annual planned sales and production volume of 565 units.
8.3.1Cost of Machinery
To manufacture the structural and mechanical elements of the machine, specific workshop equipment must be acquired:
| Equipment / Machine | Specification | Lifespan | Qty | Unit Cost (Tk.) | Total Cost (Tk.) |
|---|---|---|---|---|---|
| Lathe Machine | CQ6230A Single Phase Conventional Manual Lathe (4.5 feet) | 20 years | 2 | 1,70,000/- | 3,40,000/- |
| Drill Machine | BOKY Bench/Pillar Drill (13mm chuck capacity) | 10 years | 1 | 9,000/- | 9,000/- |
| Arc Welding Machine | ARC300 IGBT Inverter Arc Welder | 10 years | 2 | 15,820/- | 31,640/- |
| Total Capital Machinery Cost | 3,80,640/- | ||||
8.3.2Cost of Raw Material (per unit of product)
Direct raw material consumption per single unit of the semi-automated shoe cleaning machine:
| Raw Material Item | Required Qty / Unit | Unit Rate (Tk.) | Cost / Product (Tk.) |
|---|---|---|---|
| Mild Steel Sheet | 3 kg | 130/- per kg | 390/- |
| Stainless Steel Sheet (4ft × 8ft × 1mm) | 1 sheet | 5,800/- per sheet | 5,800/- |
| Nylon Brush Fiber (0.2 Nylon) | 6 units | 130/- per unit | 780/- |
| Total Raw Material Cost per Product | 6,970/- | ||
8.3.3Cost of Labor
Monthly and annual compensation for dedicated workshop operators and assembly technicians:
| Worker Role / Designation | Headcount | Monthly Wage / Person | Total Monthly Cost |
|---|---|---|---|
| Lathe Operator | 2 | 22,500/- | 45,000/- |
| Drilling & Cutting Operator | 2 | 10,000/- | 20,000/- |
| Welding Operator | 2 | 11,000/- | 22,000/- |
| Assembly Staff | 4 | 9,000/- | 36,000/- |
| Floor & Facility Cleaning Staff | 2 | 7,000/- | 14,000/- |
| Miscellaneous (15% Festival Bonus + 6% Performance Incentive) | — | Pooled (approx.) | 40,000/- |
| Total Cost of Labor per Month | 1,77,000/- Tk. | ||
| Total Annual Labor Cost (12 Months) | 21,24,000/- Tk. | ||
8.3.4Purchasing Cost per Unit of Product (External Parts)
Off-the-shelf and outsourced electromechanical parts required per machine unit:
| Purchased Part | Price per Unit (Tk.) | Quantity | Total Cost (Tk.) |
|---|---|---|---|
| Spur Gear | 250/- | 10 | 2,500/- |
| Worm Gear | 1,270/- | 4 | 5,080/- |
| AC to DC Converter | 645/- | 1 | 645/- |
| Nut & Bolt Set | 25/- | 20 | 500/- |
| Ball Bearing | 99/- | 20 | 1,980/- |
| DC Motor (1 HP) | 4,829/- | 2 | 9,658/- |
| Solid Shoe Shiner | 3,000/- | 1 | 3,000/- |
| Total Purchasing Cost per Unit Product | 23,363/- Tk. | ||
8.3.5Manufacturing Overhead Cost
Indirect production expenses including technical supervisory personnel, utility consumption, and facility rental:
| Cost Item | No. of Posts | Monthly Salary / Rate | Monthly Cost (Tk.) |
|---|---|---|---|
| Production Manager | 1 | 30,000/- | 30,000/- |
| Manufacturing Engineer | 1 | 25,000/- | 25,000/- |
| Quality Control Manager | 1 | 20,000/- | 20,000/- |
| Power & Industrial Electricity Consumption | — | Variable utility | 15,000/- |
| Factory Facility Rent | — | Fixed lease | 25,000/- |
| Total Overhead per Month | 1,15,000/- Tk. | ||
| Total Annual Manufacturing Overhead (12 Months) | 13,80,000/- Tk. | ||
8.3.6Total Manufacturing Cost
Aggregated direct and indirect manufacturing expenditures for the annual planned volume (565 units):
| Cost Component | Annual Amount (Tk.) |
|---|---|
| Cost of Raw Material | 39,38,050/- |
| Cost of Purchasing (External Parts) | 1,32,00,095/- |
| Cost of Direct Labor | 21,24,000/- |
| Manufacturing Overhead | 13,80,000/- |
| Total Manufacturing Cost (TVC) | 2,06,42,145/- Tk. |
8.4Non-Manufacturing Cost
Non-manufacturing costs encompass expenses not directly tied to shop-floor fabrication but indispensable for administrative governance, sales channels, logistics, and executive operations across the product lifecycle.
8.4.1Administrative Cost
Monthly compensation and headcount for executive leadership and office personnel:
| Administrative Role | No. of Posts | Monthly Salary / Person | Monthly Cost (Tk.) |
|---|---|---|---|
| Chief Executive Officer (CEO) | 1 | 60,000/- | 60,000/- |
| Chief Financial Officer (CFO) | 1 | 50,000/- | 50,000/- |
| Chief Marketing Officer (CMO) | 1 | 40,000/- | 40,000/- |
| Product Development Officer | 1 | 25,000/- | 25,000/- |
| Administrative Clerk | 1 | 10,000/- | 10,000/- |
| Total Administrative Salary per Month | 1,85,000/- Tk. | ||
| Total Annual Administrative Cost (12 Months) | 22,20,000/- Tk. | ||
8.4.2Sales & Marketing Expense
Commercialization and outreach budget for enterprise market penetration:
Monthly Salary: 20,000/- Tk.
Annual Salary: 2,40,000/- Tk.
Annual Budget: 60,000/- Tk.
8.4.3Bank Loan & Interest
Debt financing structure for startup capital expenditure:
| Expense Category | Annual Cost (Tk.) |
|---|---|
| Administration | 22,20,000/- |
| Office Rent | 2,00,000/- |
| Sales & Marketing | 3,00,000/- |
| Bank Loan (Annuity Repayment) | 3,01,972/- |
| Advancement for Factory Space | 2,00,000/- |
| Municipal Taxes | 60,000/- |
| Insurances | 80,000/- |
| Commercial Utilities | 77,551/- |
| Total Non-Manufacturing Cost (TFC) | 34,39,523/- Tk. |
8.5Total Cost
Comprehensive annual operational and production budget summary:
| Cost Classification | Total Amount (Tk.) |
|---|---|
| Manufacturing Cost (Variable Cost, TVC) | 2,06,42,145/- |
| Non-Manufacturing Cost (Fixed Cost, TFC) | 34,39,523/- |
| Total Comprehensive Annual Cost | 2,40,81,668/- Tk. |
8.6Break-Even Analysis
The break-even point establishes the volume of production at which total revenues precisely match total fixed and variable costs.
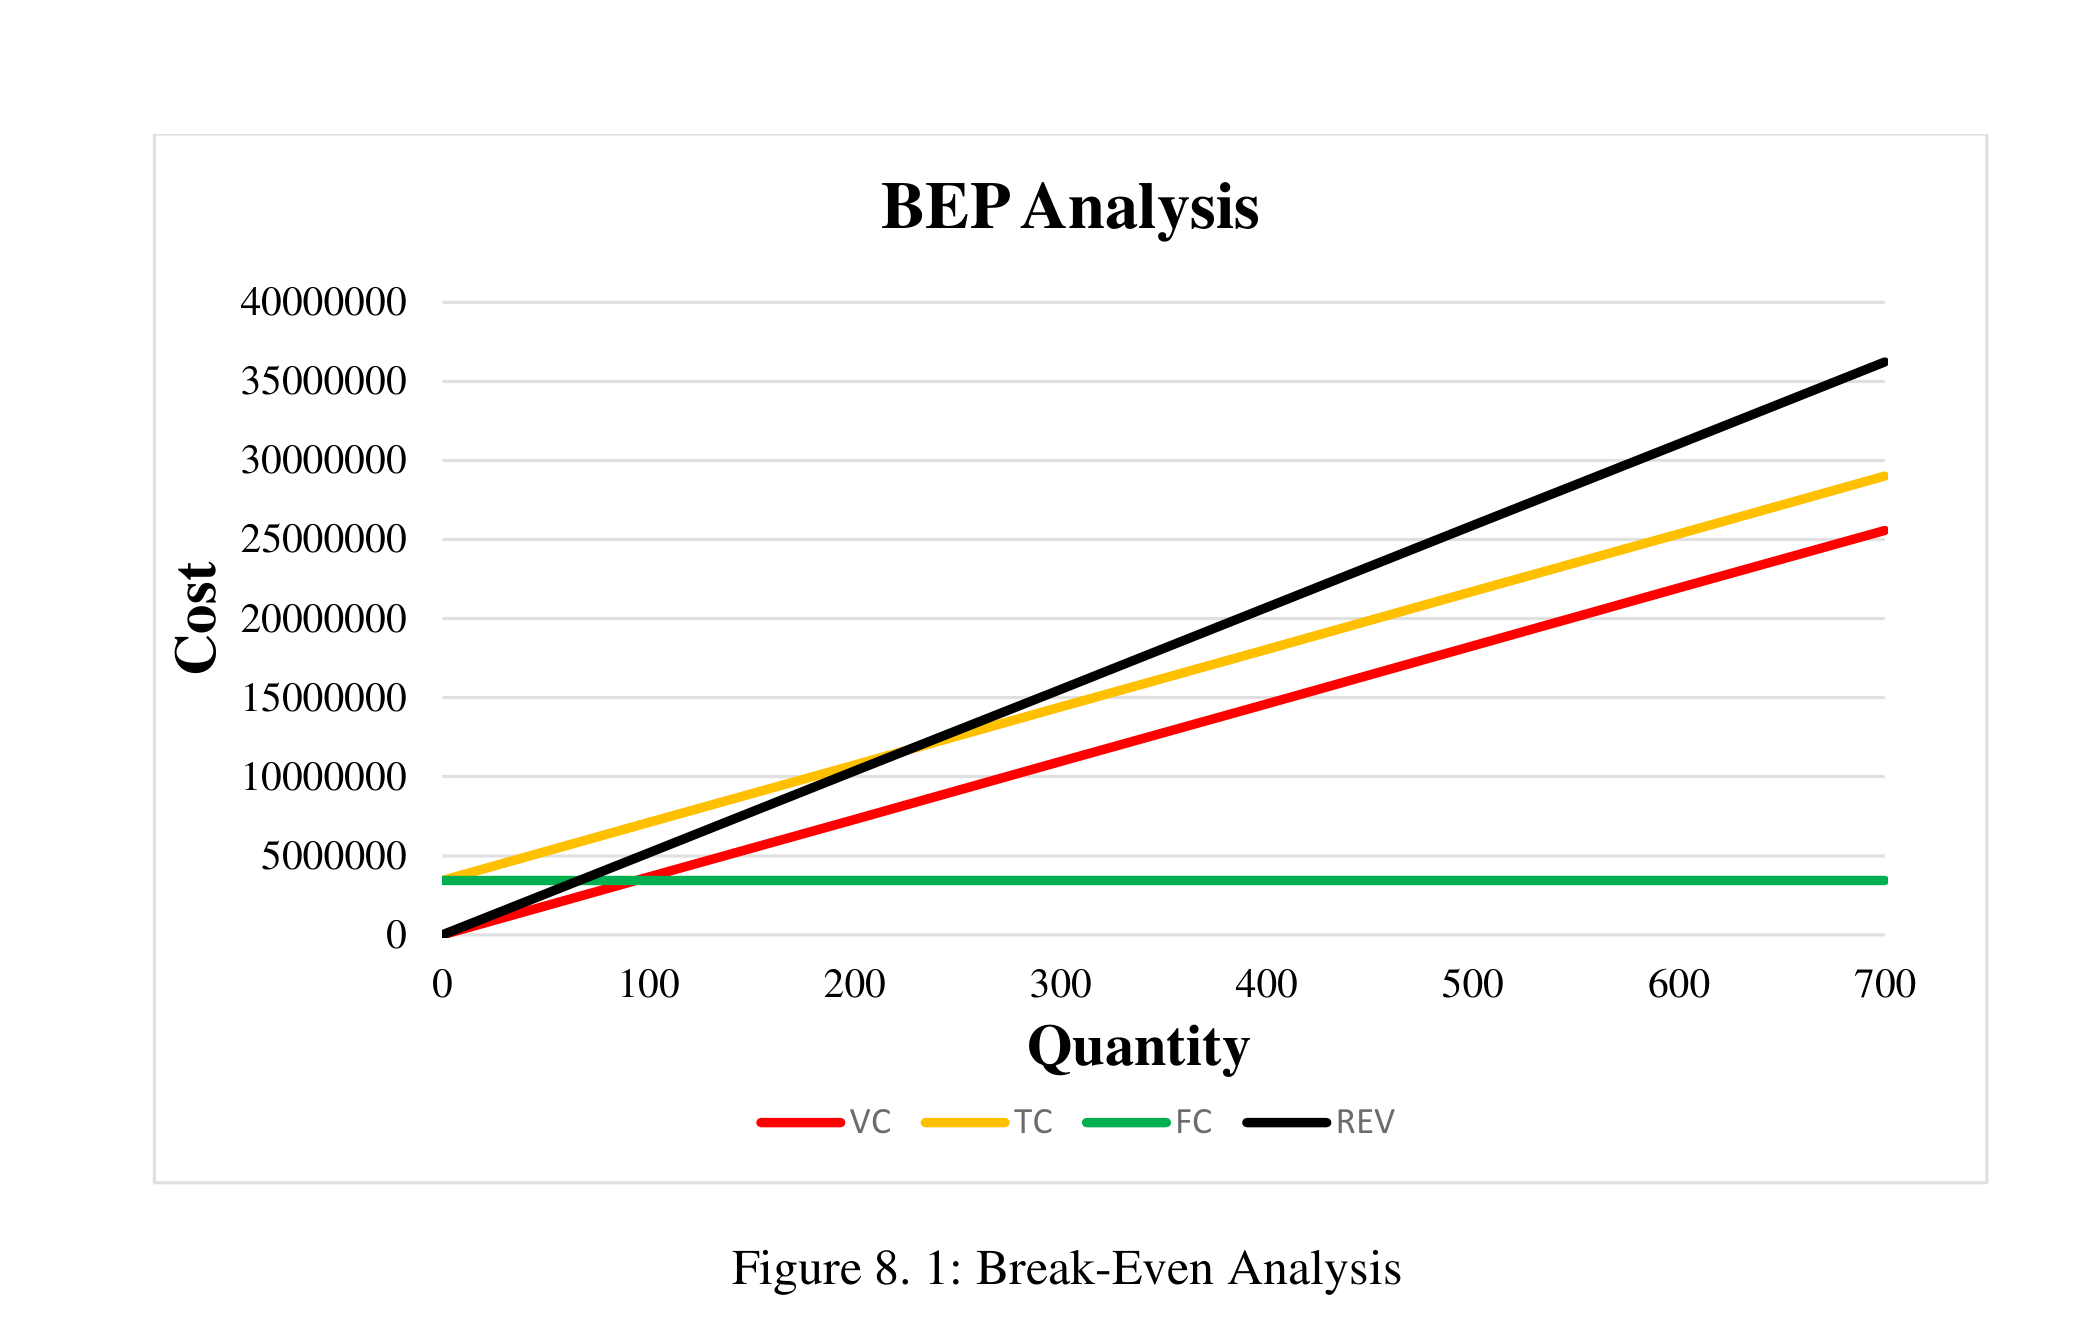
8.7Sensitivity Analysis
Sensitivity analysis provides insight into how sensitive the break-even threshold ($Q_{BEP}$) is to individual variations in cost, revenue, and demand parameters. In this analysis, a separate 10% adverse parameter shock is evaluated across each cost and operational driver to determine parameter vulnerability.
8.7.1Sensitivity of Demand
Baseline planned production is 565 units per year. Under a 10% increase in market demand ($622$ units):
Thus, sales demand volume does not alter the break-even quantity threshold itself; the break-even point is completely insensitive to demand changes.
8.7.2Sensitivity of Direct Material Cost
| Material Cost Component | Annual Amount (Tk.) |
|---|---|
| Cost of Raw Material | 39,38,050/- |
| Cost of Purchasing (External Parts) | 1,32,00,095/- |
| Total Direct Material Cost | 1,71,38,145/- Tk. |
Evaluating an adverse 10% surge in raw materials and purchased component costs:
Outcome: The break-even threshold is critically sensitive to direct material prices, requiring 57 additional units (+25.22%) to break even.
8.7.3Sensitivity of Direct Labor Cost
Baseline annual labor expenditure is 21,24,000/- Tk. Subject to a 10% wage and bonus escalation:
Outcome: Break-even is moderately resilient to direct labor wage increases, causing only a 6-unit increase (+2.65%).
8.7.4Sensitivity of Administrative Fixed Cost
Baseline annual administrative cost is 22,20,000/- Tk. Subject to a 10% administrative inflation shock:
Outcome: Administrative overhead exhibits a noticeable 15-unit (+6.64%) effect on break-even feasibility.
8.7.5Sensitivity of Selling & Marketing Expenses
Baseline sales and promotion expense is 3,00,000/- Tk. With a 10% budget expansion:
Outcome: Commercial marketing expenses have an extremely minimal effect (+0.88%) on the break-even threshold.
Sensitivity Ranking Across All Cost Drivers
| Parameter Evaluated | Parameter Shift | New $Q_{BEP}$ | Sensitivity ($\Delta Q_{BEP}$) | Impact Classification |
|---|---|---|---|---|
| Direct Material Cost | +10% | 283 units | 25.22% | Critical (Highest Impact) |
| Administrative Fixed Cost | +10% | 241 units | 6.64% | Moderate Sensitivity |
| Direct Labor Cost | +10% | 232 units | 2.65% | Low Sensitivity |
| Selling / Marketing Expenses | +10% | 228 units | 0.88% | Minimal Sensitivity |
| Market Demand Volume | +10% | 226 units | 0.00% | No Impact on $Q_{BEP}$ |
It can be clearly observed that direct material costs exert the dominant influence on the break-even point ($+25.22\%$). The cost analysis is concerned with determining the monetary value of inputs (raw materials and purchased mechanical assemblies), called the overall cost of production, which dictates the optimum level of batch production. The comprehensive financial modeling confirms that the semi-automated shoe cleaning machine achieves financial break-even within 4.8 months (226 units), establishing robust commercial and operational feasibility.
Future Scope & Limitations
9.1Introduction
This chapter examines the future scope and limitations of the Semi-Automated Shoe Cleaning Machine, a device designed to simplify and improve the process of cleaning footwear in residential and commercial settings. With a focus on semi-automation, ease of use, and affordability, the product aims to address the challenges of maintaining shoe hygiene in busy urban and rural households. This section explores how the design could evolve to include advanced features such as full automation, enhanced cleaning efficiency, and smart monitoring systems to meet growing consumer demands. Furthermore, the chapter identifies and evaluates key limitations, such as reliance on external power sources, limited cleaning versatility, and maintenance concerns. By outlining potential improvements and acknowledging existing constraints, this chapter provides a strategic roadmap for the product's continued development and market relevance.
9.2Future Scope
The Semi-Automated Shoe Cleaning Machine has significant potential for future enhancements to increase its utility and customer appeal. Some key areas for engineering and functional development include:
Fully Automated Cleaning Cycle
Complete elimination of manual intervention by integrating programmable microcontrollers and motorized shoe positioning mechanisms for a touchless cleaning experience.
IoT & Smart Sensor Integration
Embedded optical and current sensors to monitor cycle duration, water consumption, detergent dosage, and real-time brush wear diagnostics via mobile telemetry.
Interchangeable Cleaning Heads
Modular quick-release brush assemblies designed for diverse footwear materials, including soft horsehair for suede, synthetic bristles for leather, and stiff nylon for athletic footwear.
Heated Air Rapid Drying System
Incorporation of a low-power PTC ceramic heating element and tangential blower fan to expedite shoe drying immediately following the wet washing cycle.
Expanded Detergent Reservoir
High-capacity fluid storage compartments with level sensors engineered for uninterrupted, continuous operation in commercial hubs, retail outlets, and hotels.
Lightweight Structural Composites
Strategic replacement of select mild steel components with reinforced carbon fiber or high-impact polymers to enhance product portability without sacrificing rigidity.
Multi-Pair & Extended Sizing
Dimensional and mechanical adaptation of the chassis to accommodate oversized work boots, children's shoes, and dual-slot fixtures for concurrent multi-shoe servicing.
Industrial Aesthetics & Mechanism Optimization
Collaborative industrial styling with external engineering design firms to refine exterior contours, reduce mechanical drag, and enclose gear trains for whisper-quiet operation.
Solar & Renewable Energy Integration
Optional DC photovoltaic solar panel arrays with integrated lithium-ion battery backup systems for off-grid commercial deployment and heightened environmental sustainability.
9.3Limitations
While the Semi-Automated Shoe Cleaning Machine offers a practical solution to footwear maintenance, certain technical and operational limitations currently constrain its performance and commercial versatility. The identified operational constraints include:
Grid Electricity Dependency
The machine currently relies strictly on 220V AC wall power, which restricts its operational flexibility in rural, mobile, or power-interrupted localities without auxiliary generation.
Tread Inaccessibility on Deep Grooves
Standard cylindrical and side brushes exhibit limited penetration when scrubbing complex, deeply lugged hiking boot soles or heavily textured upper embellishments.
Footwear Dimensional Constraints
The fixed-dimension washing bay cannot accommodate non-standard footwear sizes (e.g. extreme oversized work boots or very small infant shoes) without risk of poor brush contact.
Limited Fluid Reservoir Capacity
The onboard water and liquid detergent tanks require frequent manual replenishment during peak high-volume operational cycles in commercial lobbies.
Mechanical Wear on Brushes & Rollers
Continuous abrasive friction against diverse rubber soles precipitates periodic bristle bending and polymer degradation, dictating regular replacement intervals.
User Intervention in Semi-Automation
The semi-automated architecture necessitates manual shoe insertion, orientation holding, and cycle triggering, falling short of a fully autonomous hands-off appliance.
Acoustic Noise During Peak Operation
Mechanical gearing, spur gears, and motor rotation generate audible operating noise that may cause minor disruption in quiet office environments or executive boardrooms.
Wastewater & Residue Filtration
The existing gravity-drain system lacks integrated centrifugal or multi-stage filtration to separate heavy mud cakes and particulate sludge from the effluent liquid.
9.4Conclusion
The Semi-Automated Shoe Cleaning Machine presents an innovative and accessible solution to maintaining shoe hygiene, particularly in environments where time and convenience are critical. By integrating semi-automation, compact design, and essential cleaning features, it successfully addresses key pain points for everyday users.
However, this analysis underscores the need for ongoing improvement in areas such as automation, versatility, and sustainability to meet evolving market expectations. In summary, the Semi-Automated Shoe Cleaning Machine serves as a robust foundation for future advancements. By embracing innovative upgrades and addressing its current limitations, the product has the potential to emerge as a versatile and indispensable household and commercial cleaning solution.
Roadmap for Commercial & Mechanical Maturation
| Code | Current Limitation | Planned Technological Countermeasure | Development Phase | Feasibility |
|---|---|---|---|---|
| L1 | Grid Power Dependency | Solar PV panel kit with 24V Li-ion battery backup bank | Phase 2 (Medium-term) | High (92%) |
| L2 | Deep Tread Inaccessibility | Interchangeable high-density contoured brush heads | Phase 1 (Immediate) | Very High (98%) |
| L3 | Chassis Dimensional Bounds | Adjustable-width guide rails and multi-shoe bay expander | Phase 2 (Medium-term) | High (88%) |
| L4 | Fluid Reservoir Refills | Plumbed direct-inlet water connection with float valves | Phase 1 (Immediate) | Very High (95%) |
| L5 | Bristle Mechanical Wear | Self-lubricating wear-resistant nylon 6/6 and quick-swaps | Phase 1 (Immediate) | High (90%) |
| L6 | Semi-Automated User Effort | Optical proximity sensor cycle activation and motorized feed | Phase 3 (Long-term) | Moderate (78%) |
| L7 | Operating Gear Noise | Helical composite gears and acoustic rubber dampening mounts | Phase 2 (Medium-term) | High (91%) |
| L8 | Wastewater Sludge Buildup | Removable dual-stage sediment catch tray with drain trap | Phase 1 (Immediate) | Very High (96%) |
Conclusion
Product design is a broad term that refers to the efficient generation and development of ideas into new goods through a process. It is therefore an essential component of the development of new products. Product design might be a straightforward solution to an issue that needs to be resolved or it can be an entirely original idea that has the potential to succeed.
Our “Semi-Automated Shoe Cleaning Machine” will successfully combine semi-automated technology with conventional cleaning techniques to provide a cost-effective and practical solution for the small enterprises and people in Bangladesh. The study proves the product's viability and usefulness by in-depth market research, technical studies, and performance assessments. Quantitative analyses and cost analyses also offer a strong basis for its design and execution.
In addition to meeting the increasing need for cleaning products, this creative strategy would act as a template for aspiring engineers and designers to create and assess their own cutting-edge goods.
APPENDIX
Appendix A: Questionnaire for Survey
Field survey instrument administered to 34 participants across academic institutions, corporate offices, and commercial establishments in Dhaka.
Appendix B: Result of Tensile Test and Physical Constants of Some Materials
Empirical material characterization standards, mechanical tensile/yield properties, and physical property tables utilized in structural design, component sizing, and finite element stress verification.
Estimated minimum mechanical strength values for design safety factor evaluations per ASTM A6/A568 standards.
| 1 UNS No. |
2 SAE / AISI |
3 Process |
4 Tensile Str, MPa (kpsi) |
5 Yield Str, MPa (kpsi) |
6 Elongation in 2 in, % |
7 Reduction in Area, % |
8 Brinell Hardness |
|---|---|---|---|---|---|---|---|
| G10060 | 1006 | HR | 300 (43) | 170 (24) | 30 | 55 | 86 |
| CD | 330 (48) | 280 (41) | 20 | 45 | 95 | ||
| G10100 | 1010 | HR | 320 (47) | 180 (26) | 28 | 50 | 95 |
| CD | 370 (53) | 300 (44) | 20 | 40 | 105 | ||
| G10150 | 1015 | HR | 340 (50) | 190 (27.5) | 28 | 50 | 101 |
| CD | 390 (56) | 320 (47) | 18 | 40 | 111 | ||
| G10180 | 1018 | HR | 400 (58) | 220 (32) | 25 | 50 | 116 |
| CD | 440 (64) | 370 (54) | 15 | 40 | 126 | ||
| G10200 | 1020 | HR | 380 (55) | 210 (30) | 25 | 50 | 111 |
| CD | 470 (68) | 390 (57) | 15 | 40 | 131 | ||
| G10300 | 1030 | HR | 470 (68) | 260 (37.5) | 20 | 42 | 137 |
| CD | 520 (76) | 440 (64) | 12 | 35 | 149 | ||
| G10350 | 1035 | HR | 500 (72) | 270 (39.5) | 18 | 40 | 143 |
| CD | 550 (80) | 460 (67) | 12 | 35 | 163 | ||
| G10400 | 1040 | HR | 520 (76) | 290 (42) | 18 | 40 | 149 |
| CD | 590 (85) | 490 (71) | 12 | 35 | 170 | ||
| G10450 | 1045 | HR | 570 (82) | 310 (45) | 16 | 40 | 163 |
| CD | 630 (91) | 530 (77) | 12 | 35 | 179 | ||
| G10500 | 1050 | HR | 620 (90) | 340 (49.5) | 15 | 35 | 179 |
| CD | 690 (100) | 580 (84) | 10 | 30 | 197 | ||
| G10600 | 1060 | HR | 680 (98) | 370 (54) | 12 | 30 | 201 |
| G10800 | 1080 | HR | 770 (112) | 420 (61.5) | 10 | 25 | 229 |
| G10950 | 1095 | HR | 830 (120) | 460 (66) | 10 | 25 | 248 |
Source. Data from 1986 SAE Handbook, p. 2.15. Adapted for mechanical design calculations.
Fundamental physical, thermodynamic, and elastic constants including modulus of elasticity, modulus of rigidity, Poisson's ratio, and unit weight.
| Material | Modulus of Elasticity E | Modulus of Rigidity G | Poisson's Ratio ν | Unit Weight w | ||||
|---|---|---|---|---|---|---|---|---|
| Mpsi | GPa | Mpsi | GPa | lbf/in³ | lbf/ft³ | kN/m³ | ||
| Aluminum (all alloys) | 10.4 | 71.7 | 3.9 | 26.9 | 0.333 | 0.098 | 169 | 26.6 |
| Beryllium copper | 18.0 | 124.0 | 7.0 | 48.3 | 0.285 | 0.297 | 513 | 80.6 |
| Brass | 15.4 | 106.0 | 5.82 | 40.1 | 0.324 | 0.309 | 534 | 83.8 |
| Carbon steel | 30.0 | 207.0 | 11.5 | 79.3 | 0.292 | 0.282 | 487 | 76.5 |
| Cast iron (gray) | 14.5 | 100.0 | 6.0 | 41.4 | 0.211 | 0.260 | 450 | 70.6 |
| Copper | 17.2 | 119.0 | 6.49 | 44.7 | 0.326 | 0.322 | 556 | 87.3 |
| Douglas fir | 1.6 | 11.0 | 0.6 | 4.1 | 0.33 | 0.016 | 28 | 4.3 |
| Glass | 6.7 | 46.2 | 2.7 | 18.6 | 0.245 | 0.094 | 162 | 25.4 |
| Inconel | 31.0 | 214.0 | 11.0 | 75.8 | 0.290 | 0.307 | 530 | 83.3 |
| Lead | 5.3 | 36.5 | 1.9 | 13.1 | 0.425 | 0.411 | 710 | 111.5 |
| Magnesium | 6.5 | 44.8 | 2.4 | 16.5 | 0.350 | 0.065 | 112 | 17.6 |
| Molybdenum | 48.0 | 331.0 | 17.0 | 117.0 | 0.307 | 0.368 | 636 | 100.0 |
| Monel metal | 26.0 | 179.0 | 9.5 | 65.5 | 0.320 | 0.319 | 551 | 86.6 |
| Nickel silver | 18.5 | 127.0 | 7.0 | 48.3 | 0.322 | 0.316 | 546 | 85.8 |
| Nickel steel | 30.0 | 207.0 | 11.5 | 79.3 | 0.291 | 0.280 | 484 | 76.0 |
| Phosphor bronze | 16.1 | 111.0 | 6.0 | 41.4 | 0.349 | 0.295 | 510 | 80.1 |
| Stainless steel (18-8) | 27.6 | 190.0 | 10.6 | 73.1 | 0.305 | 0.280 | 484 | 76.0 |
| Titanium alloys | 16.5 | 114.0 | 6.2 | 42.4 | 0.340 | 0.160 | 276 | 43.4 |
Note. Adapted from engineering materials property databases and Ashby (2005). Conversion factor: 1 Mpsi = 6.89476 GPa.
REFERENCES
All references are formatted according to the American Psychological Association (APA) 7th Edition guidelines, organized systematically across research domains with verified digital identifiers and archival links.